

By Daphne von Boch
What does this mean?
“It is easier to fool people than to convince them they have been fooled.” ~ Mark Twain
Riding on the streetcar, for some time now we have been faced with screens showing rising numbers of infections. We get the same message on the news, in the papers. How are we to understand this?
1) The infection numbers alone are meaningless
The infection count is used as an indicator of how widespread a disease is in a population. For example, if there is 1 infected person per 100 tests conducted, this ratio can be extrapolated to the whole population and it can be said that around 1% of the population is infected. To come to such a conclusion, we must know not only the number of those infected but also the total number of tests that were conducted. Only in this way can it be determined if the infection count is high or low. Thus when we hear statements like “1,000 new infections” without being told the number of tests conducted, it can sound alarming. But if this infection count is based on 100,000 tests, then we can see that it is still only 1% of those tested that were infected. The more tests that are done, the more infections will be found, without any change in the ratio of infections to the total number of tests. Thus if we are told only the number of infections while the number of tests has been—silently—increased, the population can easily be alarmed by “high” infection numbers. The following graph (Fig. 1) illustrates this: The upper line represents the number of “new infections” as reported by the German media in March/April of this year—and it appears to show a runaway increase. The lower (correct) line shows the real number of infections by taking into consideration the number of tests conducted. It shows no exponential increase.
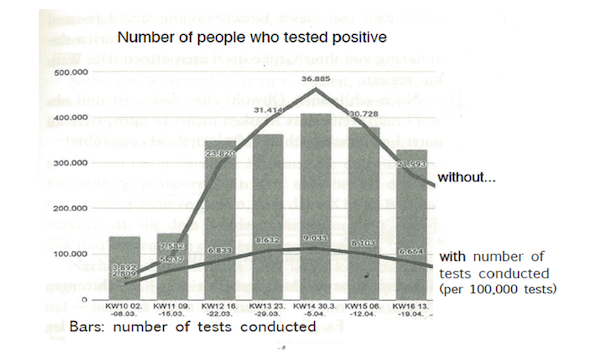
Fig. 1: Number of positive tests, with and without the number of tests conducted. The correct bottom curve, which considers the number of tests conducted, shows no exponential growth.
____________________________
*The first version of this article appeared in German in Der Europäer, Perseus Verlag, Basel, November 2020, p. 8 – 10.
Those responsible for providing these figures are well aware that both figures are required, as that is their profession. Nevertheless, in the great majority of cases the number of infections is given alone. Then there is a further problem: from the start, testing was carried out only on people already suspected of a corona infection. This is by no means a representative portion of the population, which also includes the healthy people. Once again, this contributes to a picture of more sick people than actually exist in the population—even when the number of tests conducted is taken into consideration.
2) The problem with the test itself: “positive” does not mean “infected”
To date there is only one type of test available to determine if a corona infection is present: the so-called PCRTest. If this test comes out positive, the person is considered to be infected. However, this test is oversensitive. It reacts as “positive” not only to the present coronavirus, but also in many other cases, such as to the harmless coronaviruses that occur every year in 5 to 15 % of normal flu cases, or when the person has had a flu vaccination in the past. This results in a great many “false positives”: individuals who are not in the least infected yet are counted among those genuinely infected, unjustifably inflating the official infection count. In fact, the instructions accompanying the test explicitly state that it is not approved for diagnostic purposes. Nevertheless, this “not-for-diagnostic-purposes” test remains the basis for all the restrictive measures imposed by the state. For this reason, a lawsuit is presently pending in Germany against virologist Christian Drosten, the advisor to the German Chancellor, for introducing this test. (1)
3) “Infected” does not mean “ill”
When the body is exposed to the virus, it reacts and responds to it. After several days people in weakened condition will manifest the typical symptoms of flu: fever, sore throat, and cough. They get sick. The danger of infecting others is greatest in the period right before and during the outbreak of symptoms when the virus reproduces the most and spreads—not only within those affected, but also around them. On the other hand, people who are in a healthier state can get infected without showing any symptoms at all: they go then through a “silent immunization,” becoming resistant to the virus without havig been sick. In the medical world it is very disputed whether an illness can spread without a cough and fever, since such individuals have the virus “under control”; it is not able to reproduce effectively even in them, let alone be spread to others. (2) he same is true of those who have minimal symptoms. It is important to note that infected individuals who remain asymptomatic definitely do not die of the virus, nor do individuals with minimal symptoms, except in the rarest cases. Consequently, since these people are in scarcely any danger of death themselves or of infecting others, for statistical purposes they are of no significance. Yet these individuals compose around 80% of the so-called “infected.” (3) Only 20% of the infected are actually ill, showing definite symptoms. Thus the other 80% artificially inflate the statistics.
4) “Ill” does not mean “dead”
Of those who actually contract the corona illness (with manifest symptoms), the great majority (90%) alsorecover completely, without complications, as the experience of recent months has shown. (4) One exception is elderly people in weakened condition with preexisting diseases, especially in old-age homes and nursing facilities. Quite a few of these have developed additional complications leading to death. But it must be remembered that in this final phase of life, this is what occurs with any seasonal flu. Every year in Germany, out of 10,000 people over 80 years old approximately 1,200 die. And of these 1,200, about 120 (that is, 10%) die of respiratory infections. Up to the middle of May this year—at the end of the first wave—a total of only 8 (or 0.07%) per 10,000 individuals over 80 in Germany died of the coronavirus. (Fig. 2)
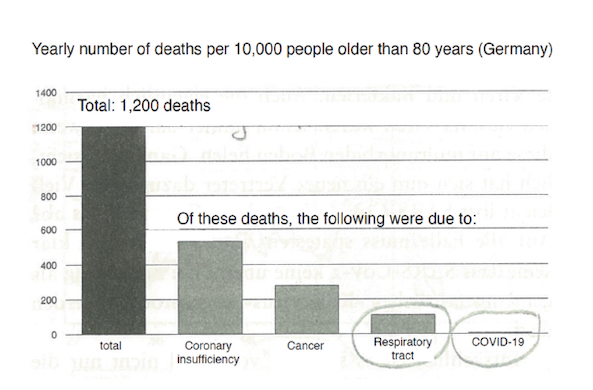
Fig. 2: Annual number of deaths per 10,000 people over 80 years of age in Germany. Out of a total of 1,200, 120 people die of respiratory infections every year. As of mid-May only 8 per 10,000 over 80 died of the coronavirus.
5) The first wave is over
As of June/July at the latest, there were hardly any more deaths—neither in Sweden , for instance, (Fig. 3) nor in Europe as a whole, including the heavily affected European countries: Italy, Spain, Belgium, and Great Britain. (Fig. 4) All of these show the same curve as Sweden. The first wave is over.
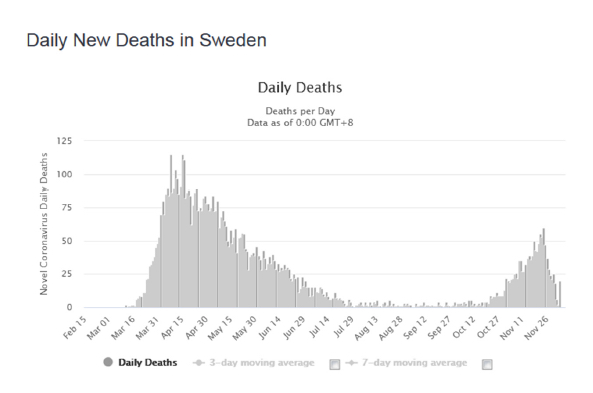
Fig. 3: Daily death count from coronavirus in Sweden, showing a minimal number of deaths after mid-July. (Status of Dec. 8, 2020)
6) The second wave
With the arrival of cooler temperatures the infection numbers have been rising again. This is normal. Cold isalways a challenge for the body as it must generate more warmth in response. Individuals who are too weak todo this will be infected by bacteria and viruses and “catch a cold,” as the expression rightly puts it. The
response is fever, an elevation of internal warmth. Among the viruses in the air at present are this year’scorona viruses. Last spring, although the lockdown severely limited the amount of exposure to it, a certain number of people already encountered this virus and their immune system developed resistance to it. Hence
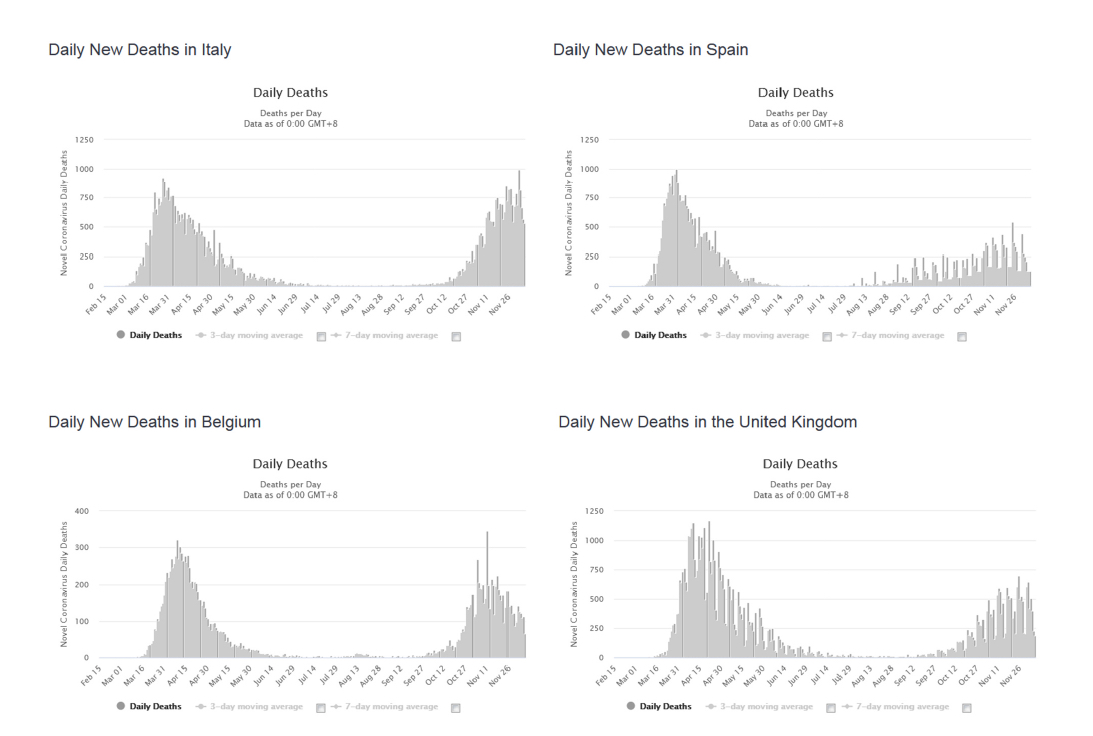
this fall we can expect lower (see Sweden, Fig. 3, the second wave is lower) —or at least similar—numbers of infections and also of deaths as in spring. This is the pattern with every flu. When part of the population has already achieved immunity, it is impossible for one and the same virus to cause a catastrophic second wave that significantly exceeds the first wave in intensity—and this applies to the coronavirus as well. This fact is not revealed by the daily infection numbers, which are, as indicated above, manipulated in various ways, but from the curve of the corona death count, which is less suceptible to manipulation. (Fig. 4) The beginning of the second wave shows a similar or flatter curve than the first wave.
Click on the image for a larger version
Fig. 4: Daily death count from coronavirus in Italy, Spain, Belgium and Great Britain (status of Dec. 8, 2020). The second wave is similar to or flatter than the first.
The Spanish Flu of 1918, which is often held up as a warning of a second wave of catastrophic size, was the only exception in history. (5) It spread at the end of the First World War. People were starving and extremely weakened from the deprivations of the war. When the first wave hit them in this condition, it further weakened them instead of strengthening them; 50 million people perished then in the second wave.
7) Has there been an epidemic at all this year?
The use of the word “epidemic” is only justified when an illness produces significant excess death in the population. Has there actually been an excess death of “epidemic proportions” this year? After all, at the end of March, an internal document of the German Ministry of the Interior predicted as many as 1.15 million deaths in
Germany alone. (6)
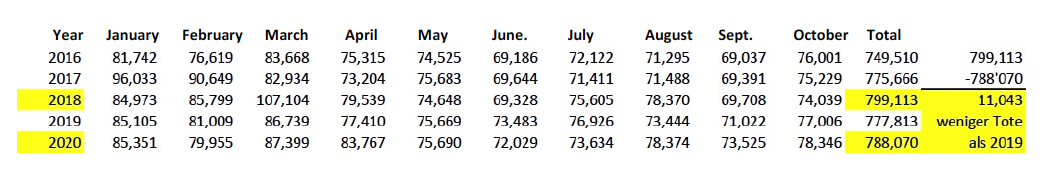
When we examine the total death count in the population (deaths due to all causes) from January to the end of October of this year, we are struck by the fact that there has been no excess death whatsoever—neither in Switzerland nor in Germany (Fig. 5 and 6). Quite the contrary: there were more deaths in other years than in the present one… without proclamation of a pandemic, without economic restrictions.
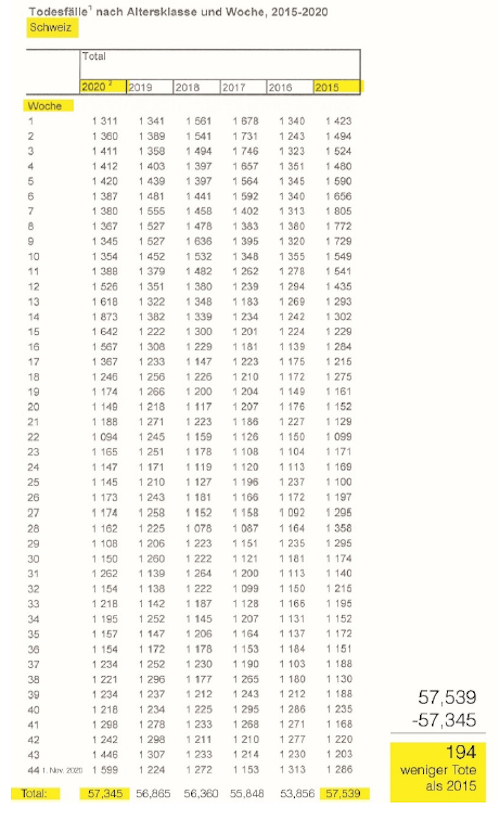
Fig. 5: Total deaths from January to October of the years 2015-2020 in Switzerlandcolon: approx. 200 fewer deaths this year than in 2015. (Status of Nov. 17, 2020)
Click on the image for a larger version
Fig. 6: Total deaths in Germany from January to October of the years 2016-2020: approx. 11,000 fewer deaths this year than in 2018. (Status of Nov. 27, 2020)
Was this positive outcome the result of a successful lockdown? If we look at Sweden, where no strict lockdown was mandated, no quarantine at home for most of
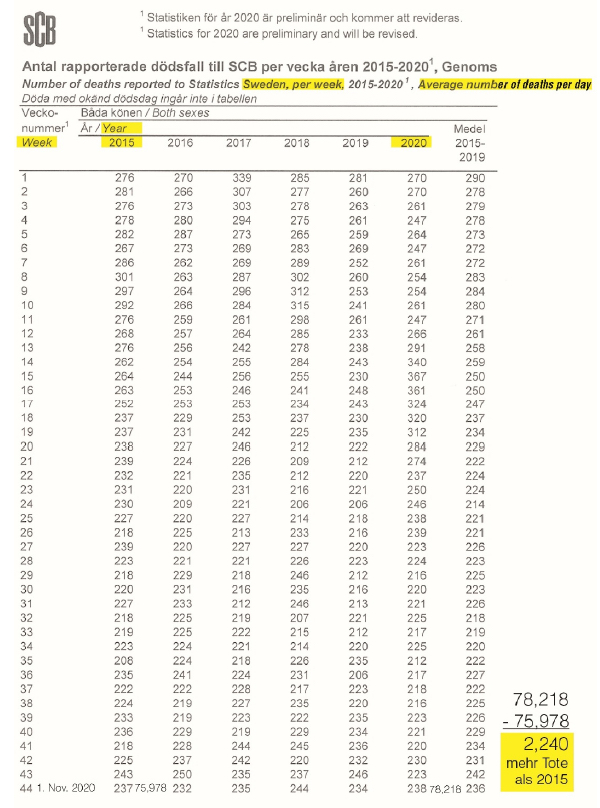
the population, no schools closed, and almost no economic restrictions imposed, we see that here as well there has been no significant excess death. Up to the end of October this year there were around 2,200 more deaths than in the same time period of 2015, a year when total deaths were somewhat higher than in other years but still within the normal range. In a population of 10 million people, that is a difference of only 0.02%. (Fig. 7)
Click on the image for a larger version
Fig. 7: Total deaths in Sweden, from January to October of the years 2015-2020: small excess death of 0.02% of the population. (tatus of Nov. 23, 2020)
Can this result be attributed to Sweden’s low population density (23 inhabitants per square kilometer), which might inhibit infection? In comparison, Germany’s population density is ten times as great. When we look at other countries which have high population densities but like Sweden did not impose strict lockdowns— Hongkong (6,890 inhabitants per square kilometer), and Japan (336 inhabitants per square kilometer)—the number of victims is nevertheless minimal. (7) Not one of them suffered a catastrophe. It makes no difference whether a strict lockdown was imposed or not: Nowhere did the corona disease cause significant excess death. Not even in China: At the end of the “epidemic” (and up to this day, December 8, 2020), fewer than 5,000 deaths have been attributed to corona… in a country with a population of 1.4 billion people. (8)
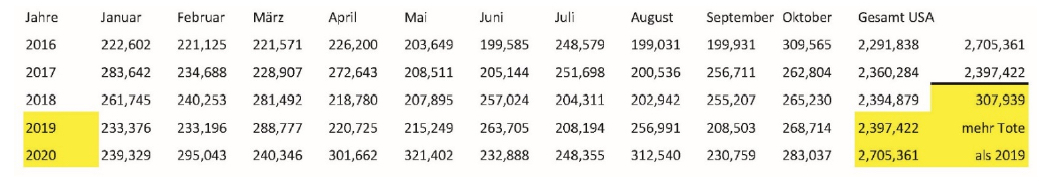
Not even in the United States Until the end of October, the total death count (due to all causes) in the U.S. was approximately 308,000 higher than in 2019, a year when there was a higher total death count than in other years but still within the normal range. And since the United States is the third-largest country in the world, with a population of 330 million people, a count of 308,000 excess death amounts to only 0.09% of the total population. (Fig. 8) That is not an excess death rate of “epidemic proportions.” Prof. Neil Ferguson of England had predicted 2.2 million deaths in the U.S., and this figure was used in large part as the basis for the restrictive measures. His estimate was seven times higher than what actually occurred. Ferguson had already been previously responsible for massive overestimates for mad cow disease, bird flu, and swine flu. Why he was brought in yet again for expert advice is hard to understand. (9)
Click on the image for a larger version
Fig. 8: Total deaths in the U.S. from January to October of the years 2016-2020: the present year shows a small excess death of 0.09% of the population. (Status of Nov. 25, 2020)
And if instead of the total death rate we consider only the number of coronavirus deaths in the U.S.? Even then we come to the conclusion that there has been no epidemic. As of December 8, 2020 the official count was approximately 290,000 corona deaths, or 88 corona deaths per 100,000 inhabitants. Comparing this with a sampling of other countries, at the moment the United States comes out better than the most heavily affected European countries: the United Kingdom registered 91 corona deaths per 100,000 inhabitants, Italy 102, Spain 100, and Belgium 155. Sweden comes out somewhat better with 70 corona deaths per 100,000 inhabitants, Switzerland registered 56 and Germany 24 corona deaths per 100,000 inhabitants. (All numbers as of December 8, 2020). (10)
Thus as in October of this year, Der Spiegel (considered by many to be a “serious” German magazine) printed the title “The Great Die-Off: The first million… and why the second will come more quickly,” )11) this assertion has to be rectified:
1) “the first million” refers not to Germany alone but to the whole world, and
2) each and every year 2.6 million people on earth die of respiratory infections (not including tuberculosis). (12)
Thus, the second million will not come “more quickly”—it simply comes every year.
Conclusion: What does it mean that the infection numbers are rising?
The rising of infection numbers which do not reflect reality, together with a virus which is not dangerous: this does not have any meaning. To use these numbers together with death counts that are not actually at epidemic levels, as a basis for imposing restrictive measures: this is deception. The facts presented here show this.
“You can fool all the people some of the time, and some of the people all the time, but you cannot fool all the people all the time.“
— Abraham Lincoln
References
- (1) Fuellmich, Reiner, “Gigantische Klage gegen Drosten und Umfeld,” [Giant suit against Drosten and associates], 9/17/2020. https://www.youtube.com/watch?v=DMQ3UyRf3Fk
- (2) Bhakdi, Sucharit/Reiss, Karina, “Corona – Fehlalarm?,” Goldberg-Verlag, Berlin, 2020, p. 64 ff. (Pubilshed in English as “Corona, False Alarm?,” Chelsea Green Publishing)
- (3) Bhakdi, ibid., p. 148.
- (4) Erickson, Daniel, Dr. Erickson Covid-19 Full Briefing AUDIO FIXED VERSION: 8, 4/28/2020. https://www.bitchute.com/video/bqknGXczpXOL
- (5) Bhakdi, p. 67.
- (6) ZDF, “Zwischen ‘schneller Kontrolle’ und ‘Anarchie'” [ Between ‘rapid control’ and ‘anarchy’], 3/31/2020. https://www.zdf.de/nachrichten/politik/f21-corona-dokument-innenministerium-100.html
- (7) Bhakdi, p. 106 ff.
- (8) Enter in internet “Worldometer Corona China”: the total number of deaths appears in the first link.
- (9) Bhakdi, p. 55.
- (10) Enter in internet „Worldometer Corona“ and name of desired country, multiply the number of total deaths with 100,000 and divide by the population number.
- (11) Der Spiegel, “Das große Sterben” [The Great Die-Off], Spiegel-Verlag Hamburg, Issue 41 of 10/2/2020.
- 12) Bhakdi, p. 36.
Figures
- Fig. 1: Corona-Initiative Deutscher Mittelstand, www.cidm.onlinee. In: Bhakdi ((see above), p. 63.
- Fig. 2: Ioannidis, John. https://doi.org/10.1101/2020.04.05.20054361. In: Bhakdi, p. 29.
- Fig. 3: Enter in internet „Worldometer Coronavirus Sweden“: click on the first link and go down to the “Daily Deaths” graph.
https://www.worldometers.info/coronavirus/country/sweden/ - Fig. 4: Enter in internet „Worldometer Coronavirus“ and name of desired country, click on first link and go down to “Daily Deaths” graph.
https://www.worldometers.info/coronavirus/country/italy/
https://www.worldometers.info/coronavirus/country/spain/
https://www.worldometers.info/coronavirus/country/belgium/
https://www.worldometers.info/coronavirus/country/uk/ - Fig. 5: Total deaths in Switzerland from January to October of the years 2015-2020. Info: Bundesamt für Statistik Schweiz (BFS).
https://www.bfs.admin.ch/bfs/de/home/statistiken/bevoelkerung/geburtentodesfaelle/todesfaelle.html
: Click on “Todesfaelle nach Altersklassen, Wochen und Kantonen.” The statistic is on the upper left. - Fig. 6: Total deaths in Germany from January to October of the years 2016-2020. Info: Bundesamt für Statistik Deutschland (Destatis). https://www.destatis.de/DE/Themen/Gesellschaft-Umwelt/Bevoelkerung/Sterbefaelle-Lebenserwartung/Tabellen/sonderauswertung-sterbefaelle.html : Click on PDF „Sterbefälle- Fallzahlen nach Tagen, Wochen, Monaten, Altersgruppe und Bundesländern für Deutschland 2016-2020“; go to pages 65-67.
- Fig. 7: Total deaths in Sweden from January to October of the years 2015-2020. Info: Bundesamt für Statistik Schweden (SCB). https://www.scb.se/hitta-statistik/statistik-efter-amne/befolkning/befolkningenssammansattning/befolkningsstatistik/pong/tabell-och-diagram/preliminar-statistik-over-doda/: Open the PDF “Preliminary statistics on deaths,“ in „Info“ click at the bottom „Tabelle 5“, then go to the top. The number of the weeks are on the left. The death numbers are the average of the seven days of the week in question, so each death number must be multiplied by seven.
- Fig. 8: Composite table of total deaths in the U.S. from January to October of the years 2016-2020. For 2019- 2020: https://data.cdc.gov/NCHS/Weekly-Counts-of-Deaths-by-State-and-Select-Causes/muzy-jte6, for 2014-2018: https://catalog.data.gov/dataset/weekly-counts-of-deaths-by-state-and-select-causes-2014-2018-4aaf7 : in “Weekly Counts…“, click on “Export” on the upper right, then in the dialog field that opens, under “Additional Format”, click on „TSV for Excel“ if you are in the U.S. or “CSV for Excel (Europe)” if you are in Europe. Open and go down to the number approx. 5,200 on the left, for 2019-2020 (down to number approx. 13,900 for 2014-2018). This is where you will find the total deaths for the whole of the U.S. From left to right, Tabel C is „Week number“, Tabel D „Week ends at…“, Tabel E „Death count all causes“.