
January 17, 2018
Rambus: Blockbuster Chartology - 2017 Annual Review
By Catherine Austin Fitts
My "go to" website for technical analysis of precious metals, the US dollar & the US stock market is Rambus Chartology, where Rambus (that's his handle - he's the founding technical analyst) leads a discussion with extensive charts of what the markets are saying.
Our series with Rambus began in October 2015 when the Solari Report did a written interview with Rambus including an introduction here and a discussion of Rambus, his background, technical analysis as well as the word "Chartology." You can find all this information at our first interview:
- Why "Rambus?"
- How Rambus Chartology Got Started
- What Rambus Chartology Does
- About Technical Analysis
- Tracking the Markets
- What does the word "Chartology" mean?
In January 2016, Rambus launched his quarterly Solari Report with a Blockbuster Chartology. You can find links to the entire series of quarterly and annual Blockbuster Chartologies at the end of this piece.
One of the reasons that Rambus is so good at his craft is that he focuses on "staying on the right side of the major trend." The challenge of doing so at this time is that it is tempting to look for bottoms or to assume that the trend upwards in the US dollar or stock market may be over. However, Rambus consistently brings us back to the discipline of the Chartology. What does price tell us? As he describes so aptly, we are dealing with psychological warfare.
Sitting back once each quarter to get this perspective offers invaluable insight. So, here we go for the 3rd Quarter 2017 Blockbuster Chartology!!
Blockbuster Chartology By Rambus
- Big Patterns: US & World Stock Market
- Halfway There?: US & World Stock Market
- Big Patterns: US Dollar, Bonds, & Commodities
- Precious Metals
Big Patterns: US & World Stock Market
Prepared on January 07, 2018For the benefit of many of our new subscribers I would like to go over some of the long term charts we’ve been following that show the secular bull market that began in the spring of 2009. Since we are beginning a new year I think now would be a good time to bring everyone up to speed on what the long term charts are strongly suggesting.
There is a lot of doubt out there about the value of long term chart patterns as most investors never look for them or even seen one. IMHO these are the most important charts to let you know how to invest your hard earned capital. If you’re a day trader these charts won’t help you, but if you’re an intermediate to long term trader these big chart patterns can greatly increase your odds for success.
This is going to sound rhetorical to most of our members, but it’s important to know chart patterns are relative to the time frame you’re looking at. If you are looking at a short term daily chart and see a six month triangle building out the impulse move will be relative to the size of the triangle. If you’re looking at a longer term weekly chart and see a triangle building out, that may be a year or two developing, then the impulse move will be relative to that pattern. This is the same concept for reversal patterns. The bigger the pattern the bigger the impulse move.
What do I consider a large chart pattern? A big chart pattern can be as small as five years or as long as 15 years or even longer in a few cases I’ve seen. I can sense your skepticism with that last sentence. Lets look at some long term charts with some big chart patterns on them so you can see for yourself if there is any validity to that last statement.
Keep in mind that any consolidation pattern has to have an even number of reversal points to be valid, 4, 6, 8 or more. A reversal pattern will have an odd number of reversal points, 3, 5, 7 or more. This goes for a pattern on a minute, daily, weekly or monthly chart. With large patterns in general you will usually see a reversal pattern form at each reversal point, which can give you a good clue, especially at the fourth reversal point, which usually is the hardest reversal point to spot in real time.
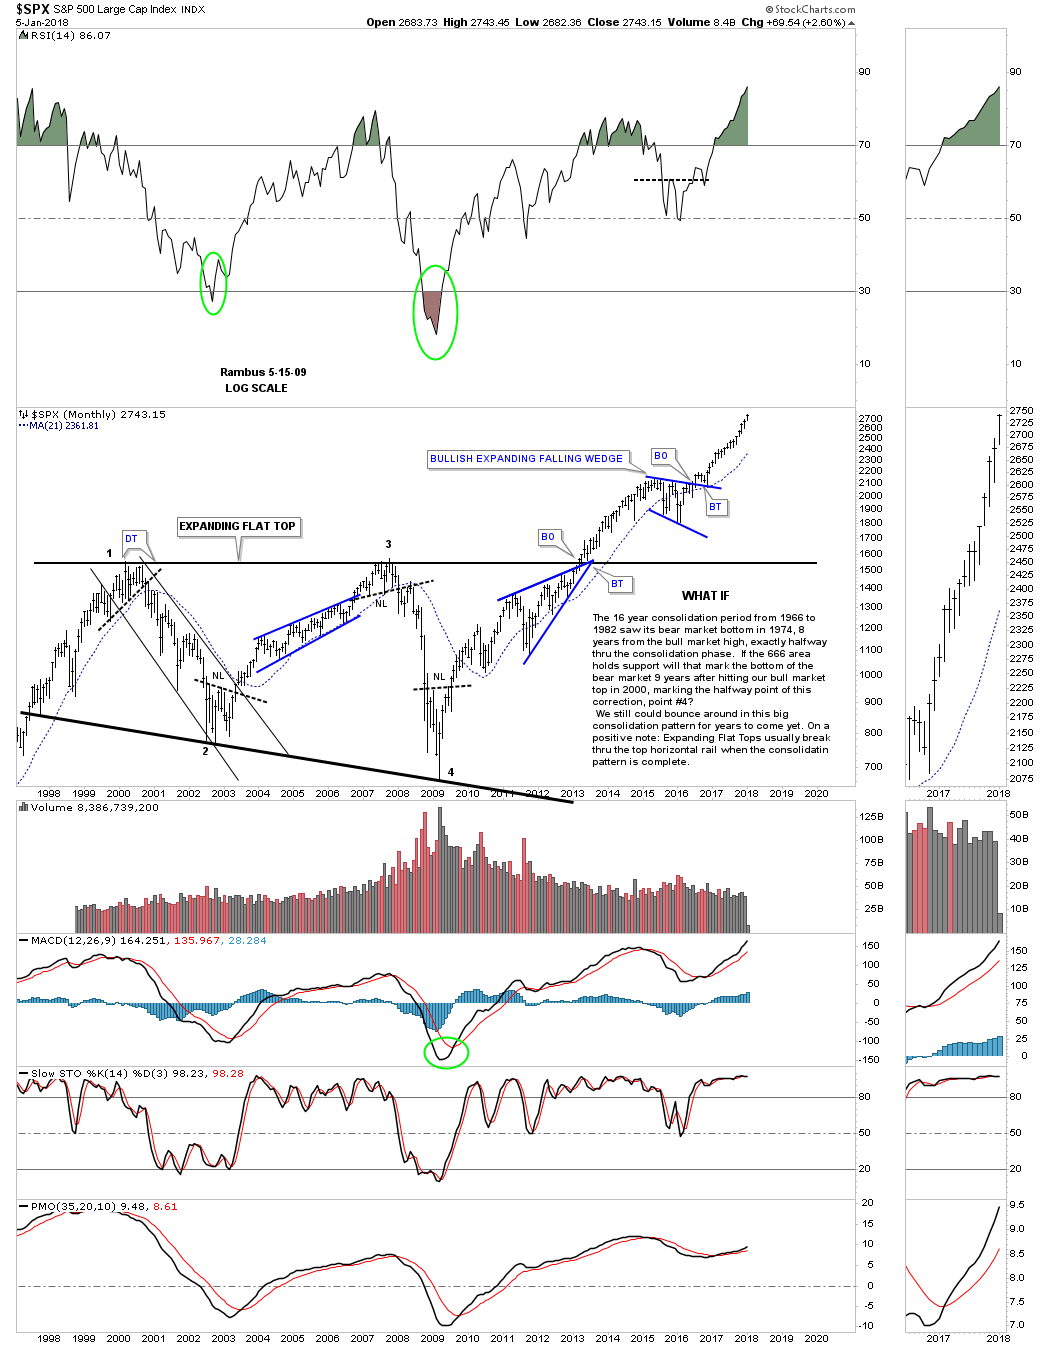
I would like to start with a 20 year monthly chart for the SPX because it was one of the first stock market indexes to breakout from its 13 year flat top expanding triangle back in 2013. Back in 2009, shortly after the crash I made a comment on this chart below on how I was speculating that we could possibly be seeing a large consolidation pattern building out. I was using an analogy from the 1970’s consolidation pattern on how it played out vs how the current multi year trading range may develop.
Back during the 1970’s consolidation period the mid reversal point formed in 1974 which ended up being the middle of the consolidation zone. I speculated that it was possible that the 2009 crash low could mark the middle of the our current trading range. It did mark the low price wise, but time wise the SPX wasted little time in rallying back up to the top of the trading range. The actual breakout took place in May of 2013 with one quick backtest before the SPX began its first impulse move higher.
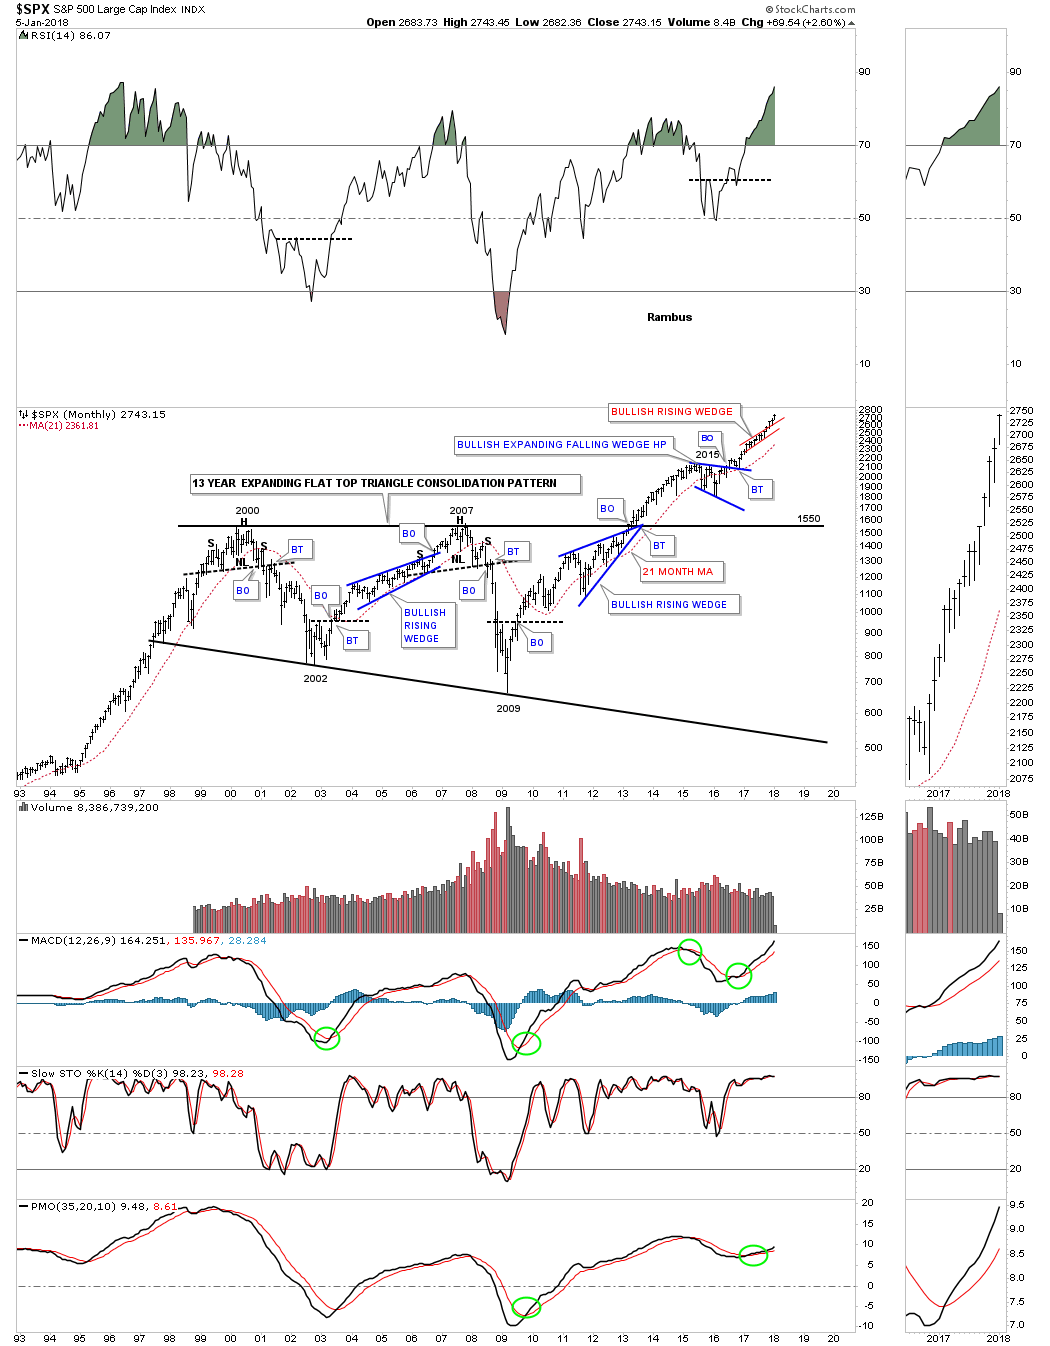
This next chart for the SPX is the same chart as the one above, but this one is the updated version. There is a lot of important Chartology on this chart that has given us many good clues on what is taking place for this 500 big cap stocks index. First, note where each reversal point formed on that 13 year expanding flat top triangle. Reversal point #1 formed at the bull market high in 2000. Reversal point #2 formed at the bear market low in 2002. Reversal point #3 formed at the the top rail during the housing bubble in 2007 and the 4th reversal point formed at the 2009 crash low. These were all very important reversal points in history which created the 13 year expanding flat top triangle consolidation pattern. You can also see a reversal pattern at each major reversal point.
A very big clue that the 13 year expanding flat top triangle was going to breakout above the top rail was when the blue bullish rising wedge formed just below the top rail. We’ve discussed this many times in the past that when you see a smaller consolidation pattern form just below an important trend line it will often times give the stock the energy it needs to finally take out resistance.
After the breakout in 2013 the SPX rallied for a little over two years before it needed to consolidate its gains starting in 2015. The first consolidation pattern that formed after the first impulse move out of that 13 year expanding flat top triangle was a blue bullish expanding falling wedge. Note the nice clean breakout and backtest which has led to our current rally phase. The little red bullish rising wedge is the same pattern we’ve been following on the stock market combo charts.
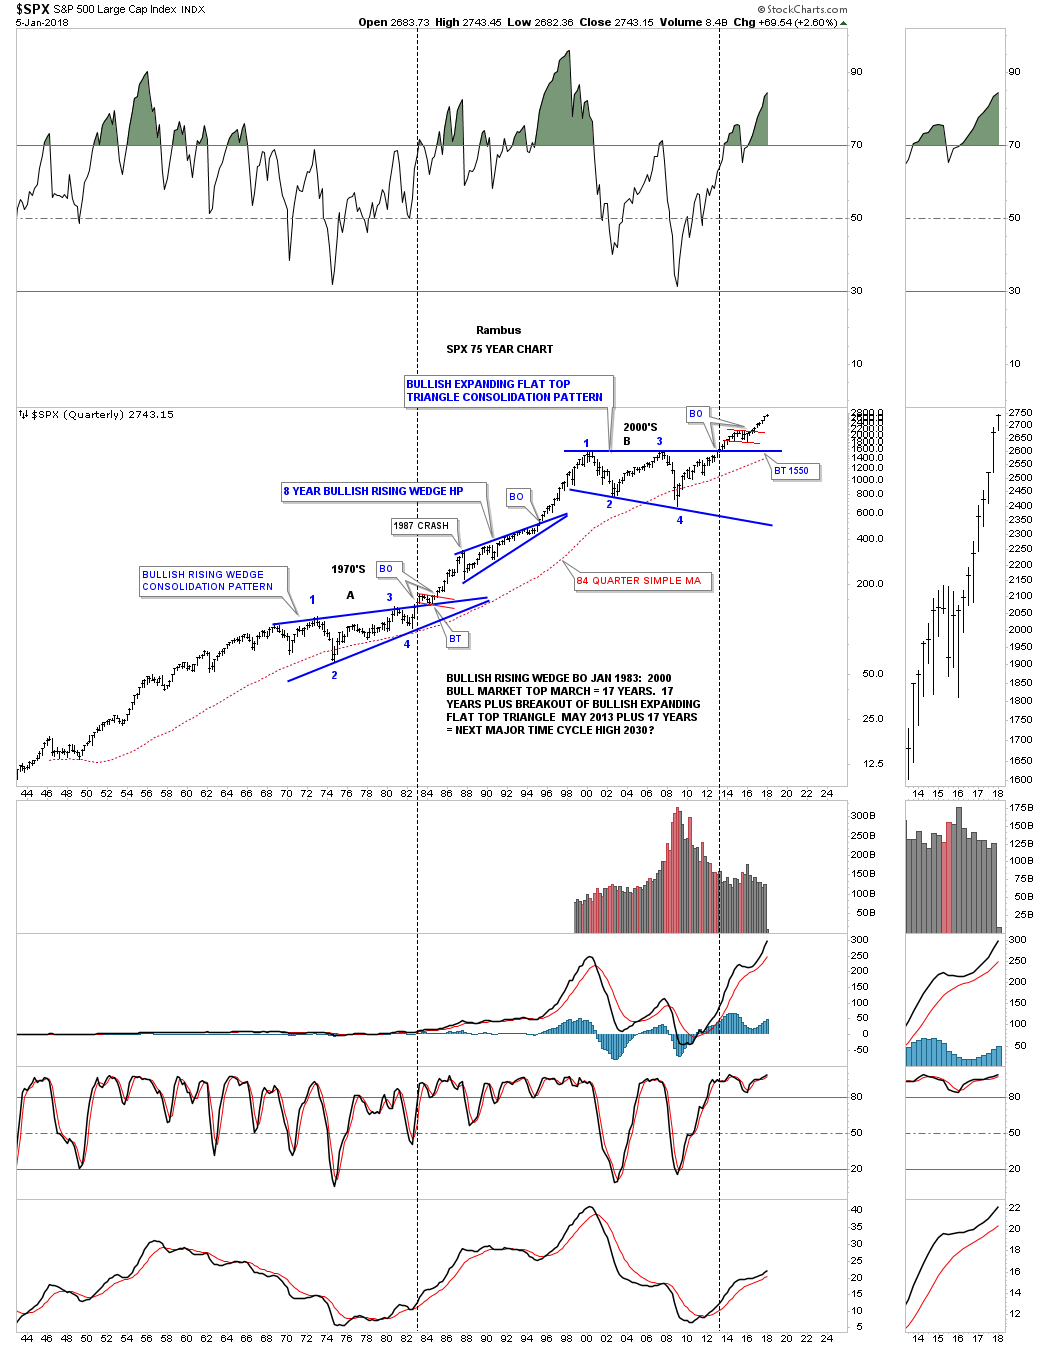
We discussed earlier in this post that the impulse move is relative to the size of the consolidation or reversal pattern that is formed. Small consolidation patterns lead to small moves while big chart patterns lead to big moves. Below is a 75 year quarterly chart for the SPX which has just three chart patterns on it with each one being a consolidation pattern. The 1970’s consolidation built out a bullish rising wedge. After the breakout the price action formed the small red bull flag as the backtest before the impulse move took off.
That initial impulse move lasted until 1987 when we got the infamous 1987 crash which is still the largest one day crash on a percentage basis in history. I can tell you from first hand experience that it felt like the end of the world at that time, but it did little to stop the secular bull market. Instead of crashing the SPX began to build out an 8 year bullish rising wedge halfway pattern which led to the eventual secular bull market top in 2000 which is the first reversal point in the 13 year flat top expanding triangle consolation pattern.
I would like to apologize for going into so much detail on the SPX charts above, but I just wanted to layout the groundwork for many more charts to follow. This is how markets work from the small time frame to the very large time frame where everything is relative. Now that you have the basic understanding of how these big chart pattern work lets look at some more long term charts as they will paint the big picture for us.
One of the most important question an investor needs to ask themselves before they put their hard earned money into the stock market is whether the stock market is in a bull or bear market. If you try to trade long during a bear market you will be fighting the downtrend the whole time you are invested. On the other hand if you trade long in a bull market you will always have the wind at your back even if your entry point is off. Time will eventually take care of your bad entry point.
The stock market indexes to follow will show you that we are in a secular bull market, not just in the US but around the world as well. Regardless of all the reasons that many see as negative signs for the stock markets the Chartology is strongly suggesting something totally different is taking place. A chart paints a picture of the fundamentals and where the investors are actually putting their money to work. That’s what matters more than anything else. A chart pattern shows you the reality of what investors are doing and not opinion.
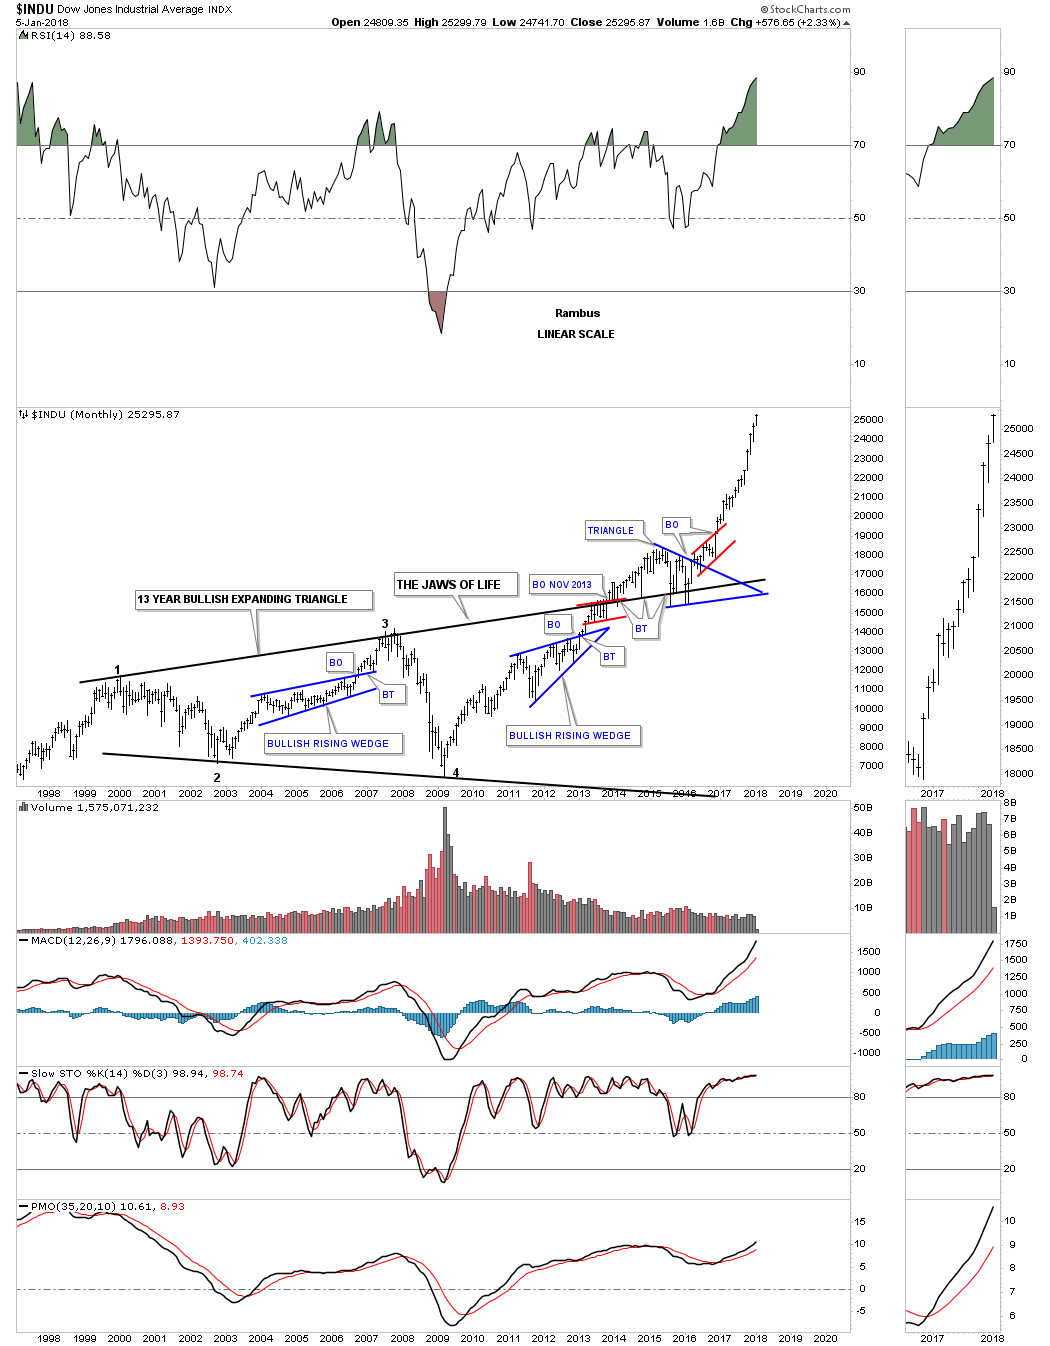
Since the INDU and the Transportation Average have the most history lets look at them next. Below is a 20 year monthly chart for the INDU which shows the 13 year Jaws of Live expanding triangle consolidation pattern. Unlike the SPX which had a quick breakout and backtest, the INDU had a laborious breaking out and backtesting process. Note the blue triangle that formed on the top rail of the Jaws of Life which was a good clue the breakout would be to the upside. What you are witnessing right now is the impulse move out of the 13 year expanding triangle. Big patterns lead to big moves.
Below is another long term relative chart for the INDU which goes back 75 years. During the 1970’s the INDU built out a beautiful and symmetrical 17 year H&S consolation pattern. It to rallied strongly into the 1987 crash where it began to form the multi year blue bullish rising wedge consolidation pattern. Note the beautiful breakout and backtest that occurred on the 1970’s neckline and the the top rail of the Jaws of Life, which were very big clues the patterns were correct and the new impulse leg up was about to begin.
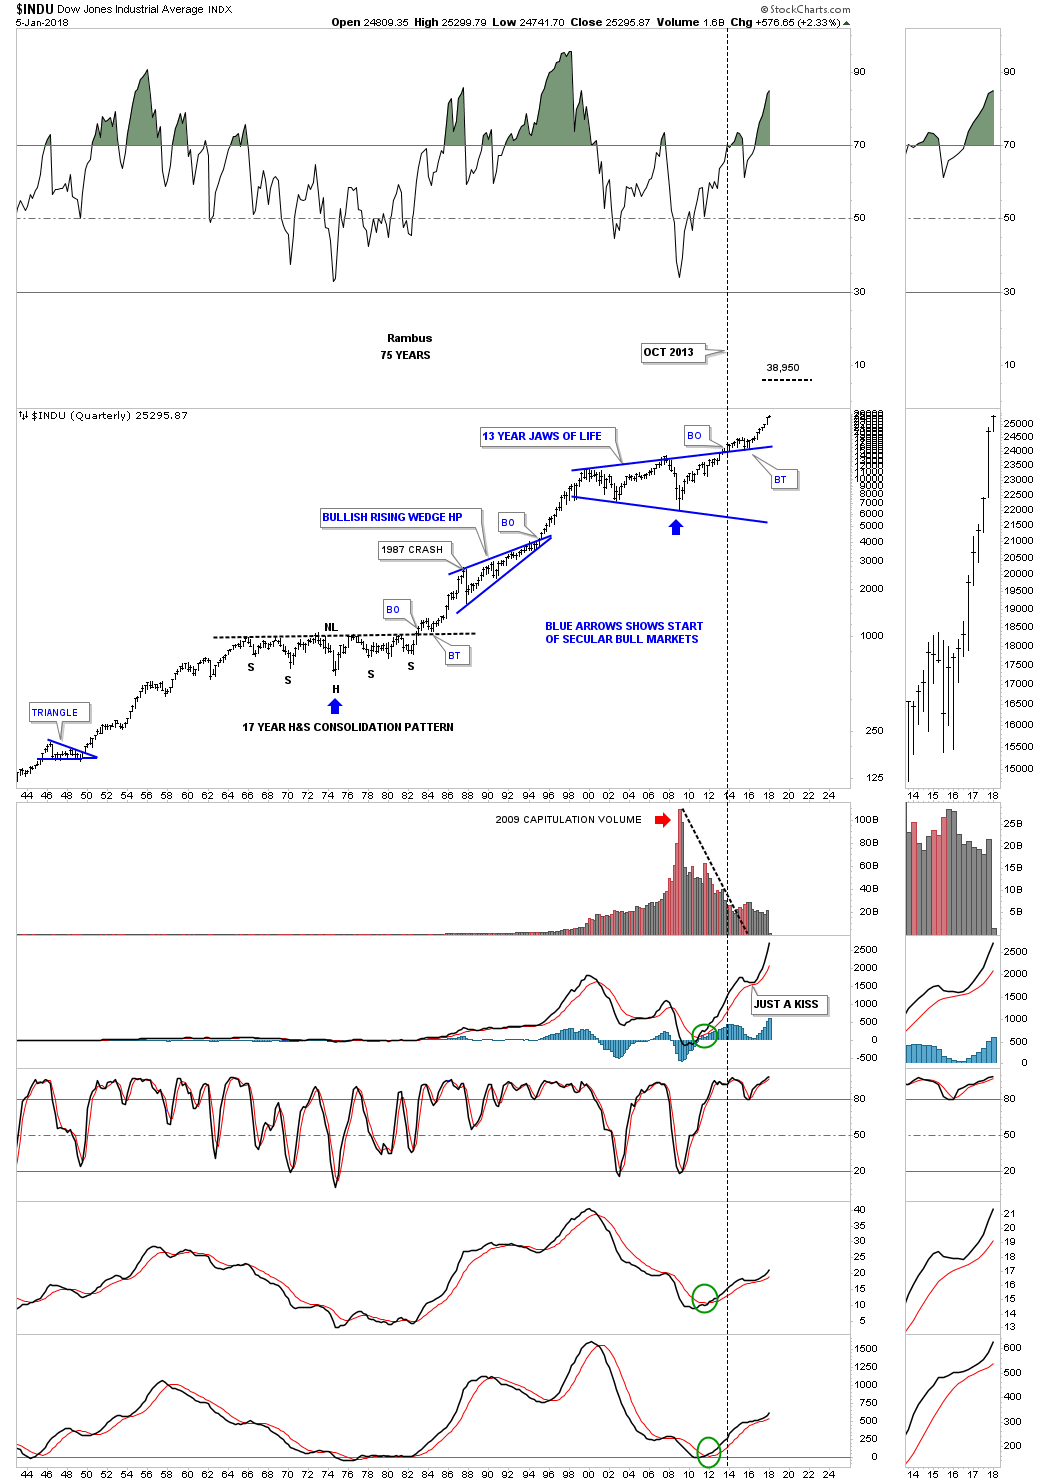
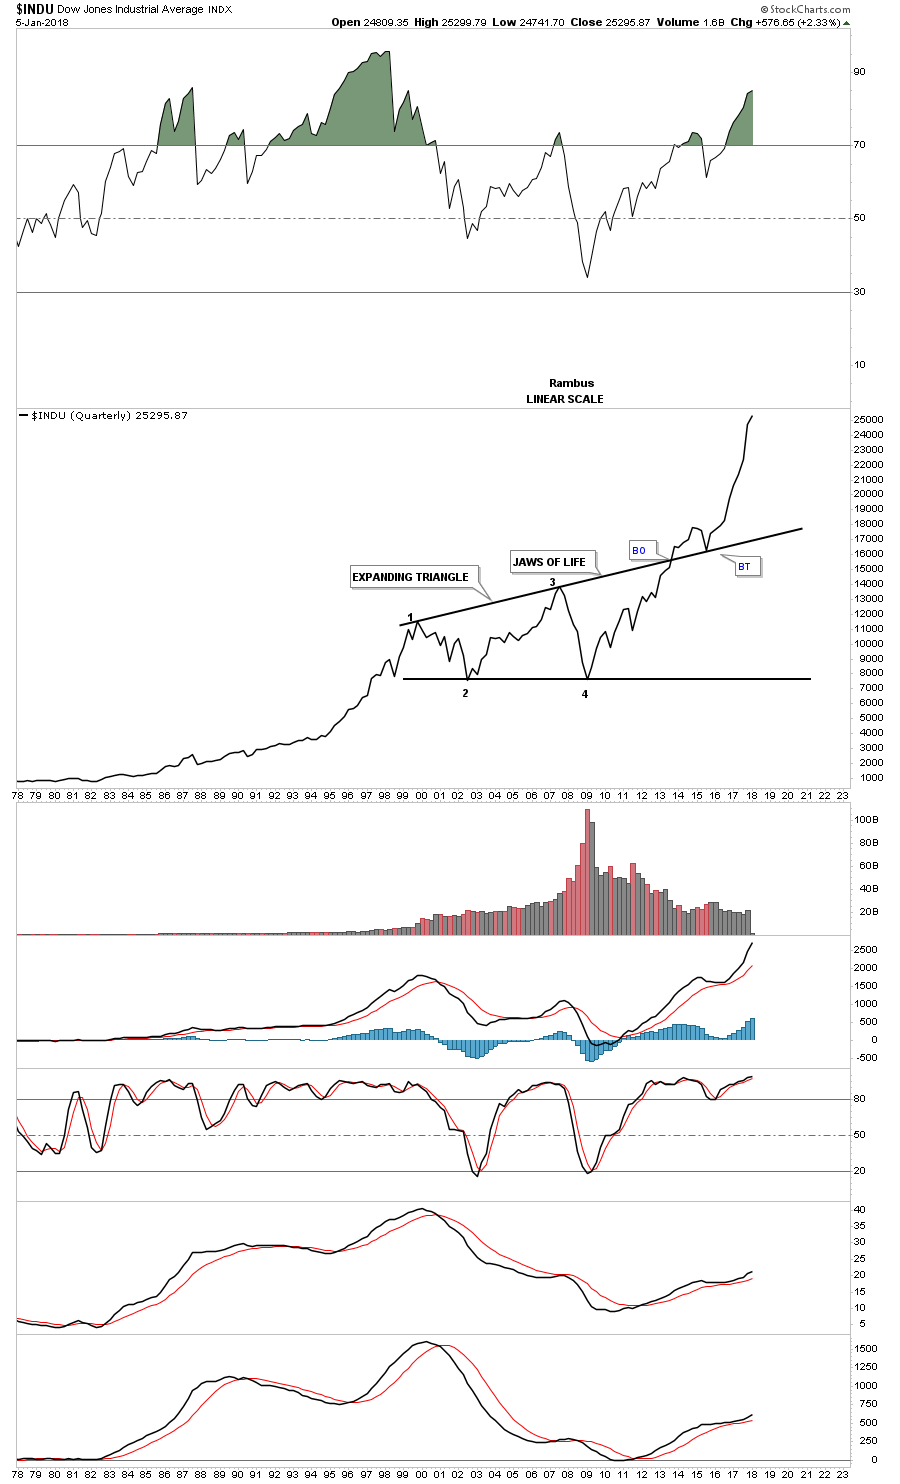
For a slightly different perspective below is a 40 year quarterly line chart which shows how the INDU looks on a quarterly closing basis. Again, big chart patterns lead to big moves.
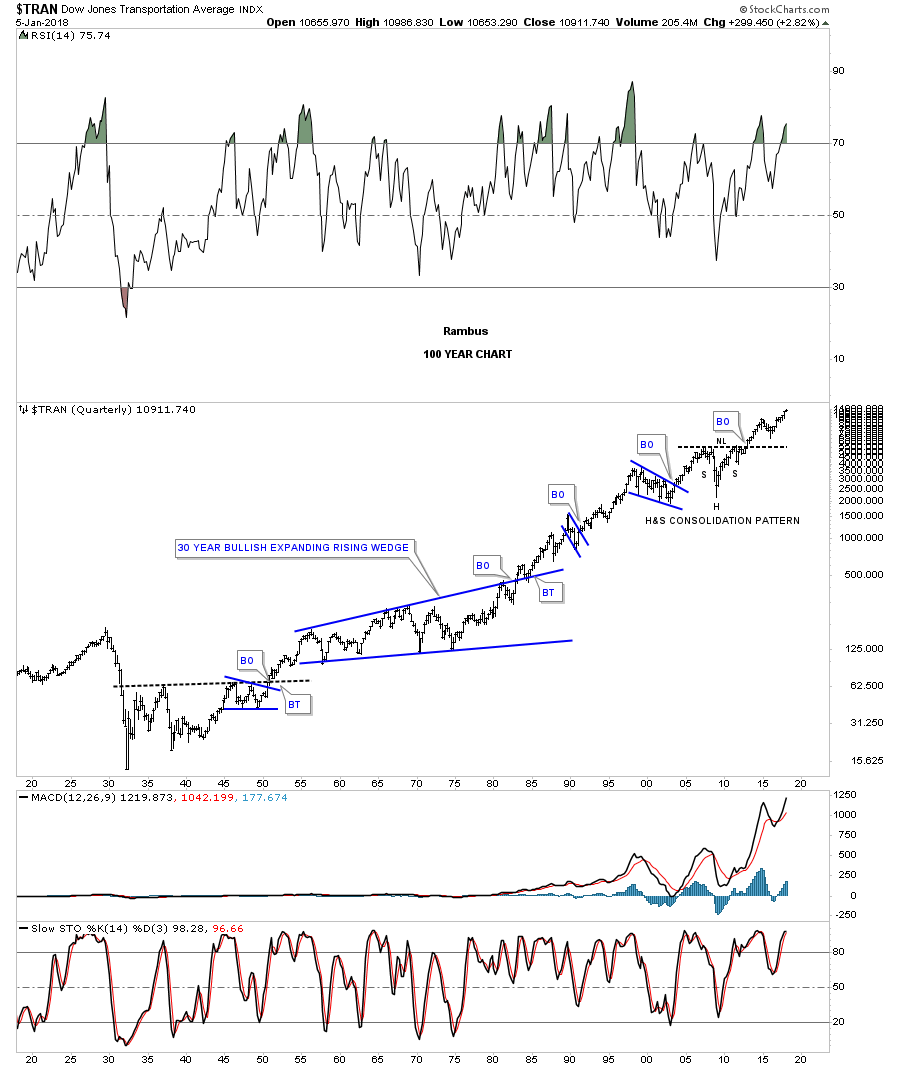
Now lets look at the Transportation Average which has over 100 years of history on it. This 20 year monthly chart has two big chart patterns on it. The first one is on the left side of the chart which was a five year bullish falling wedge. The second large chart pattern is one of the most symmetrical H&S consolidation patterns I’ve ever seen which took seven years to build out. Note the smaller H&S consolidation pattern that formed in 2015 that led to the ten month bullish rising wedge which we are currently breaking out of.
![]()
On this 100 year quarterly chart for the Transportation Average you can see the seven year H&S consolidation pattern in all its glory. There are just several instances over the last 100 years that the Transportation Average made a lower low on this quarterly chart which is pretty impressive when you think about. It’s now trading at new all time highs which is what this chart has been suggesting for a long time now.
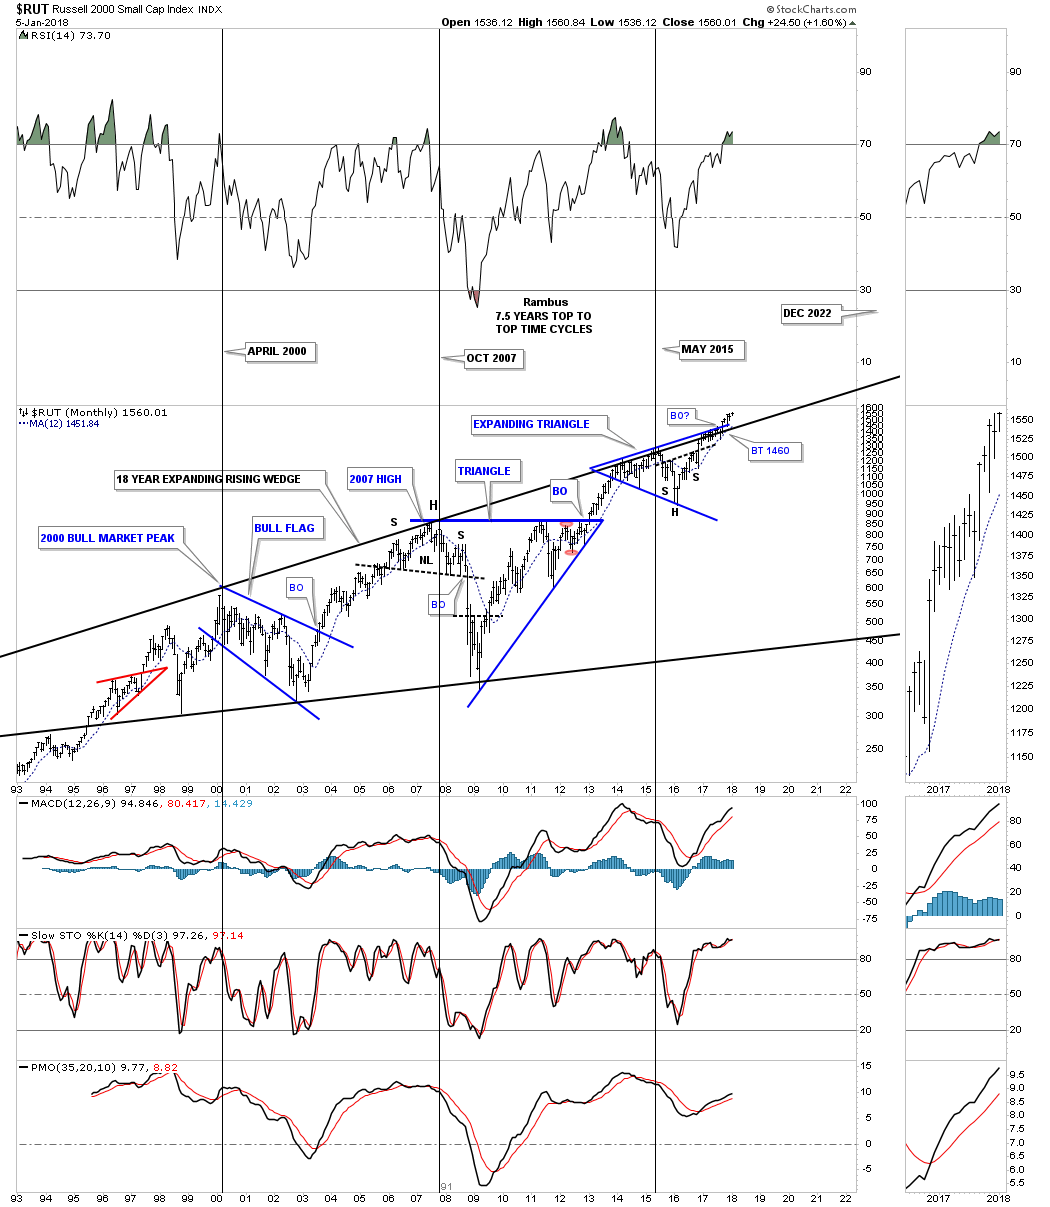
I’m going to breakdown the RUT 2000 into three different long term charts so you can see how the smaller patterns are building out the bigger pattern. As you may know the RUT has been underperforming most of the other US stock market indexes and there is a reason why from a Chartology perspective.
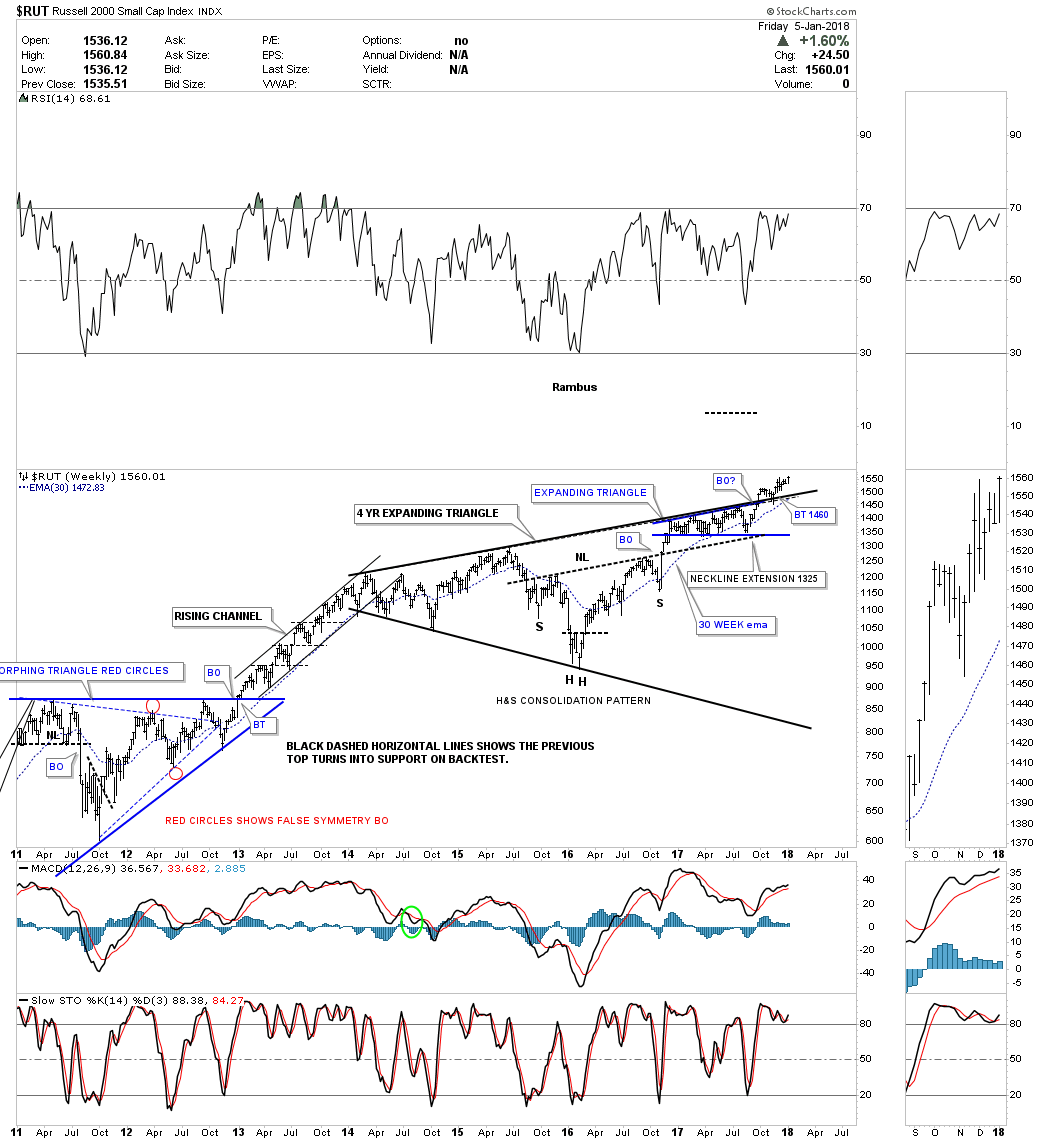
This weekly chart shows a four year black expanding triangle formation with the breakout in September of this year. Also note the smaller blue expanding triangle that formed just below that black four year top rail which gave the RUT the energy to finally breakout. There is also another very big clue that the top rail of the four year back expanding triangle was going to be broken to the upside. The H&S bottom that formed in 2016 has a price objective much higher than the top rail of the black expanding triangle consolidation pattern. Note how the neckline extension line held support on the last reversal point within the blue expanding triangle.
Now lets take the multiple chart patterns one step further and see what the four year black expanding triangle looks like on a 25 year monthly chart. You can now see why the RUT has been lagging some of the other US stock market indexes by all the overhead resistance it has been chewing through since 2013. Again, the H&S consolidation pattern has been telling us for well over a year that the top rail was going to give way, which is now happening. There are four lines of resistance that the RUT has finally broken through. The first one was the H&S consolidation neckline, that was followed by the blue expanding triangle finally giving way, followed by the black four year expanding triangle. The last resistance line was the top rail of the 18 year expanding rising wedge.
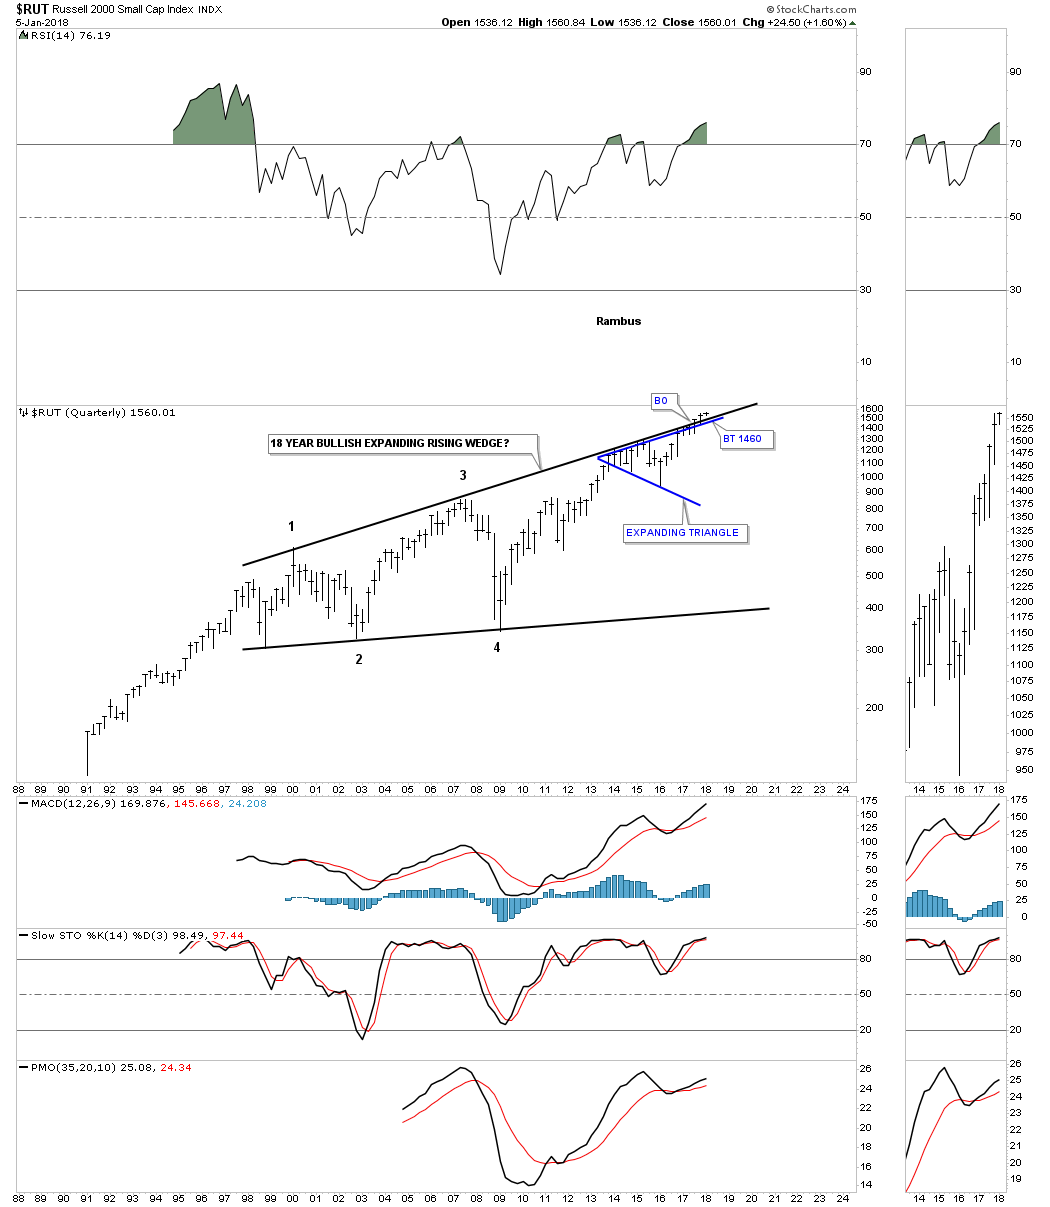
The last chart for the RUT is just a simple quarterly look which is just two big patterns.
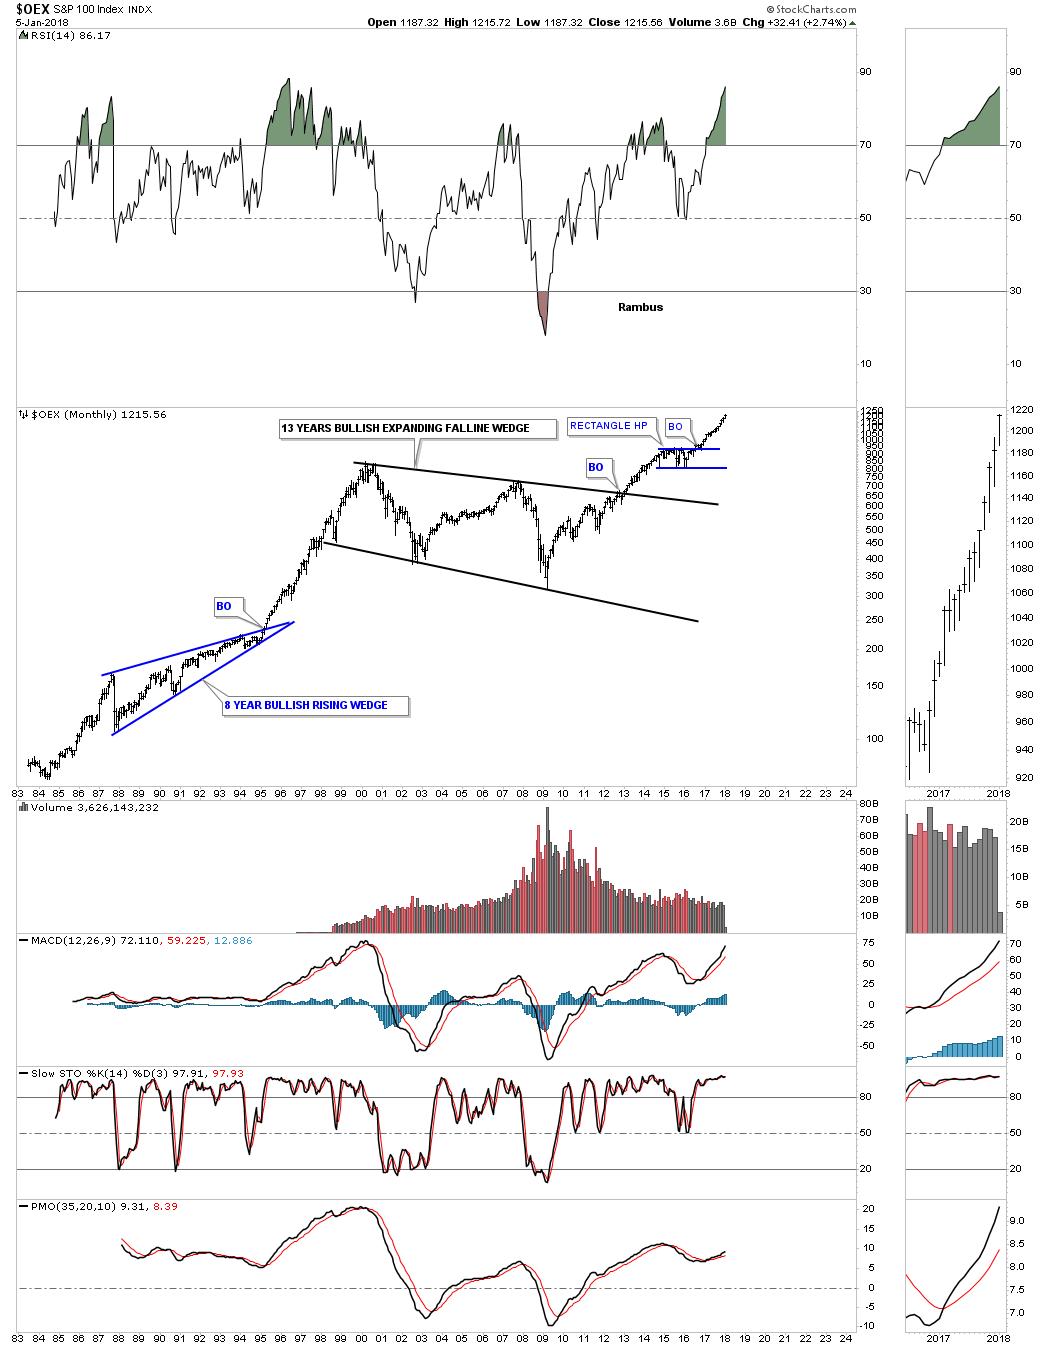
I’m going to go through this next set of long term chart very quickly as they are all pretty self explanatory. Below is the OEX 100.
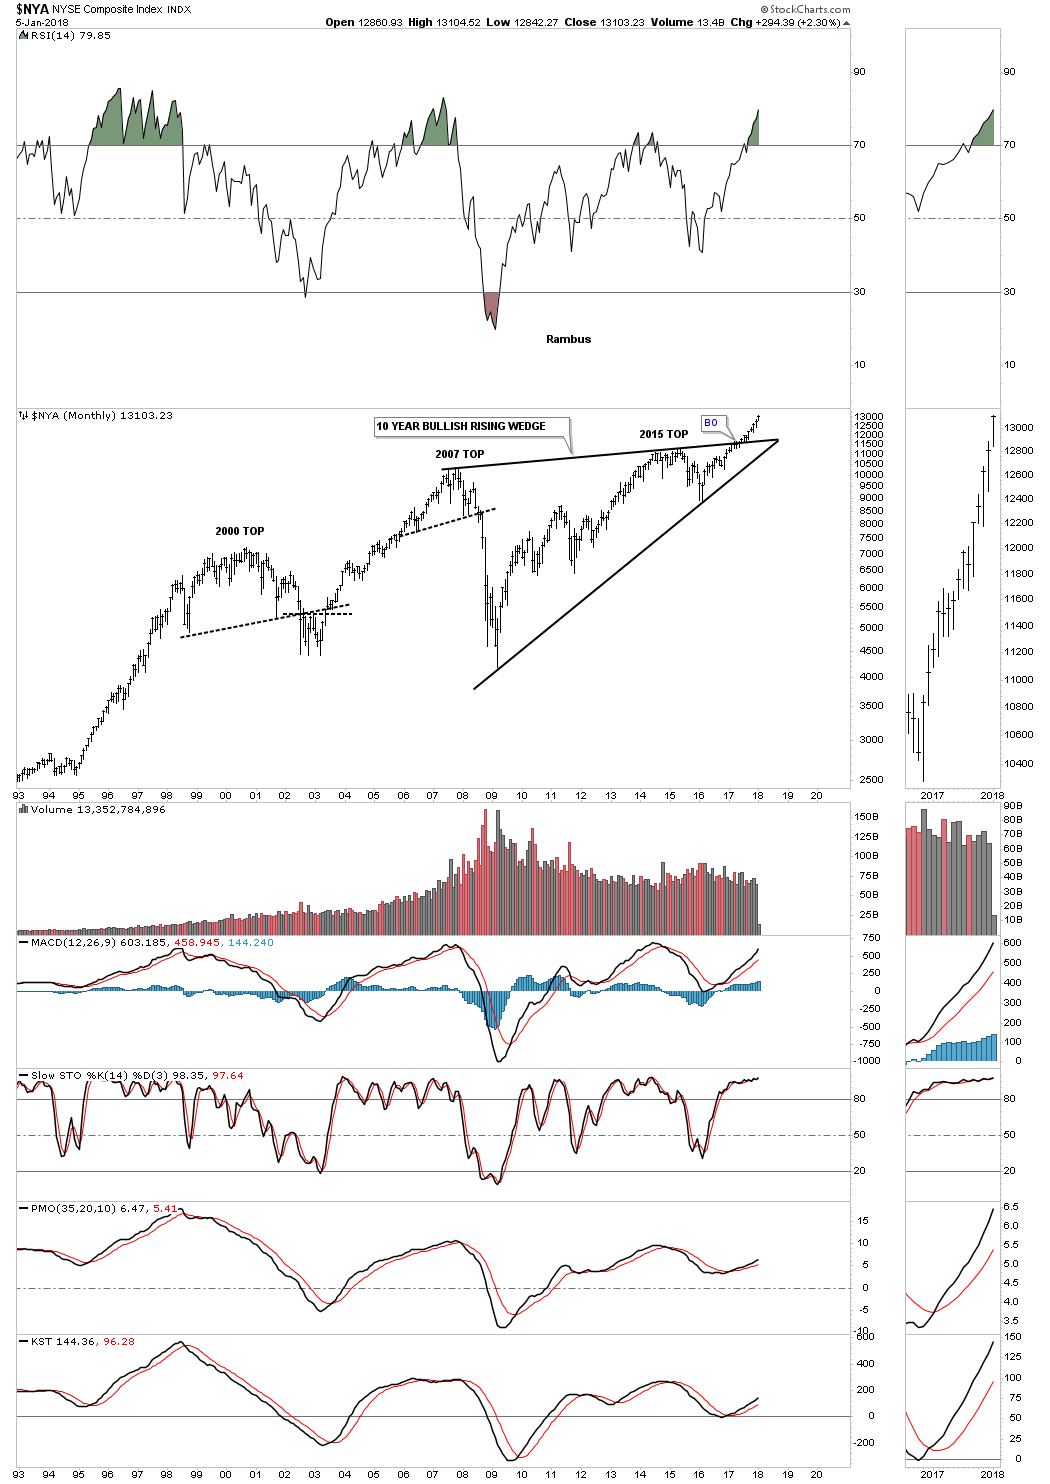
The NYA:
I know I say this about a lot of charts, but this long term 25 year monthly chart for the NDX 100 has some really beautiful Chartology on it. There is the parabolic rally into the 2000 bubble top with the red bullish rising flag as a halfway pattern. Then there is the black ten year triangle consolidation pattern with a beautiful symmetrical H&S bottom at the fourth reversal point. Then there is the blue triangle that formed just below the 2000 all time high at 4816 which we discussed earlier, was usually a bullish setup and is responsible for our current impulse move once the breakout occurred.

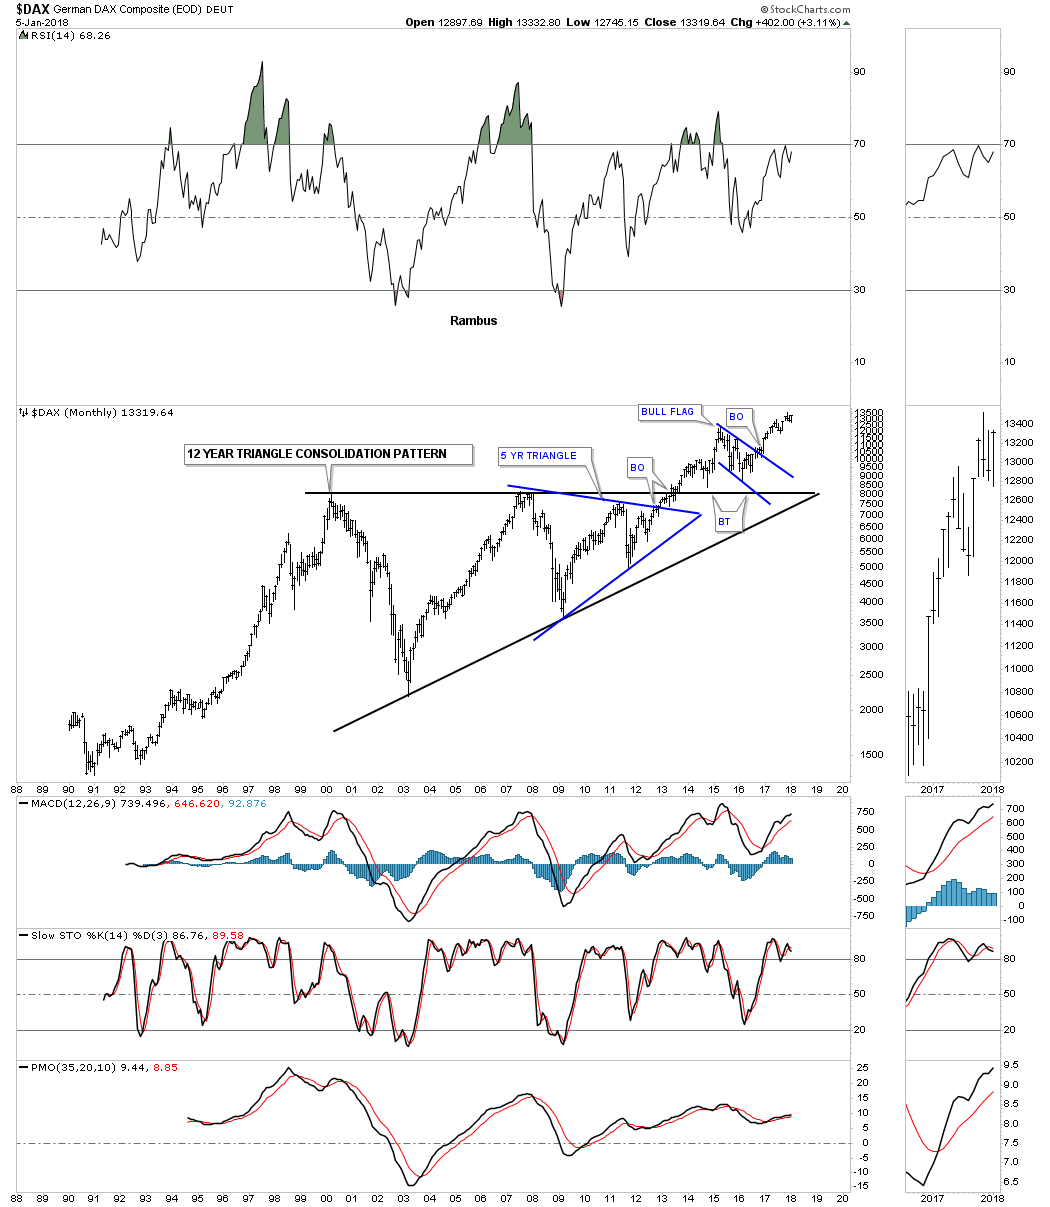
Now I would like to turn your attention to some of the European stock markets as they too have built out some large consolidation patterns which is strongly suggesting they will also enjoy a secular bull market.
$DAX monthly:
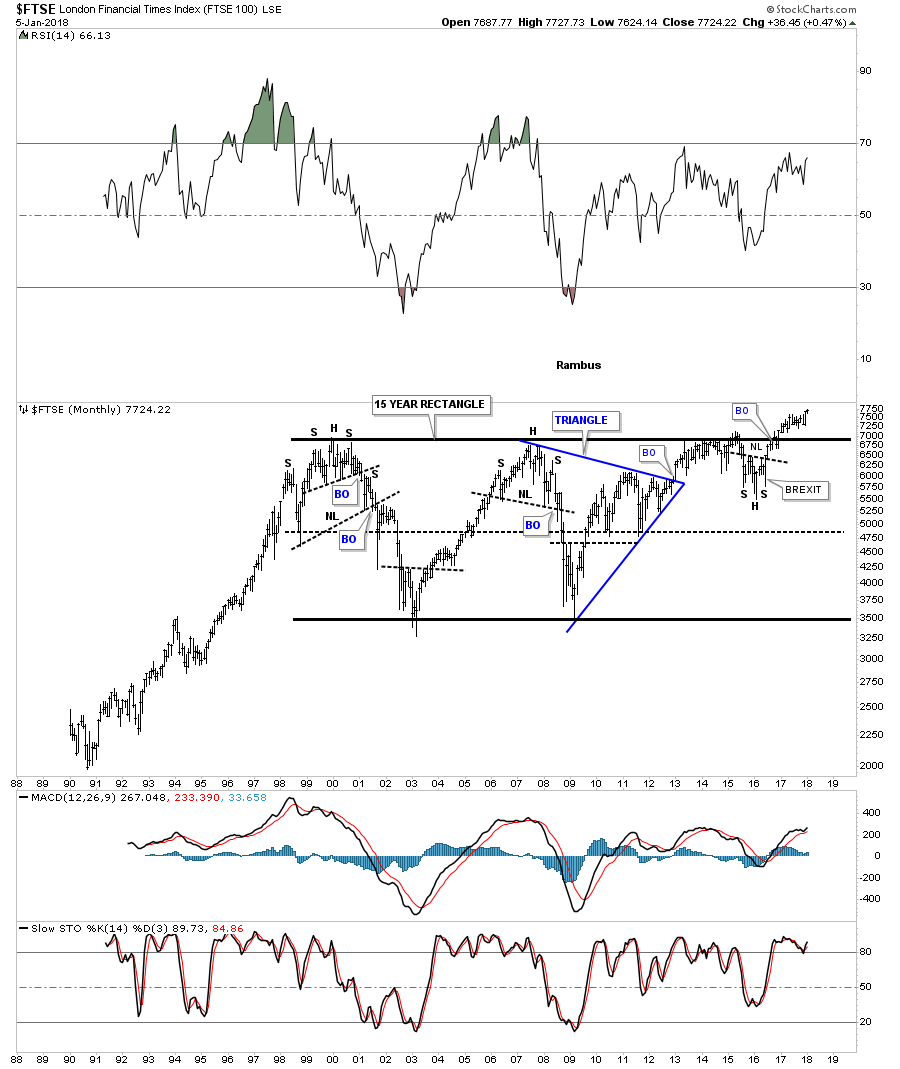
FTSE monthly:
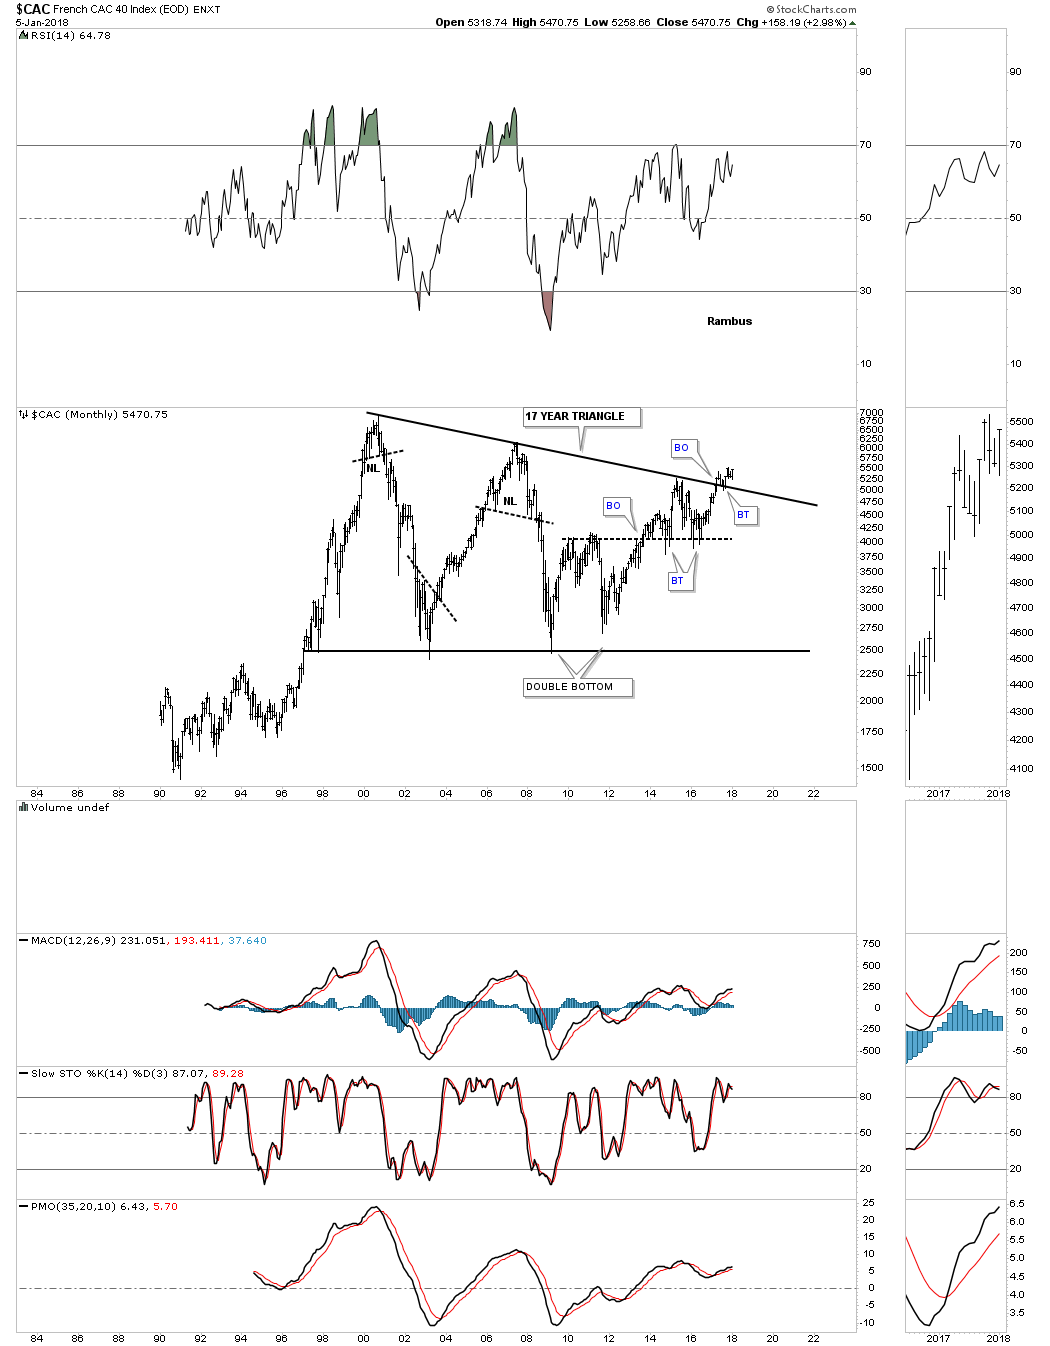
CAC monthly:
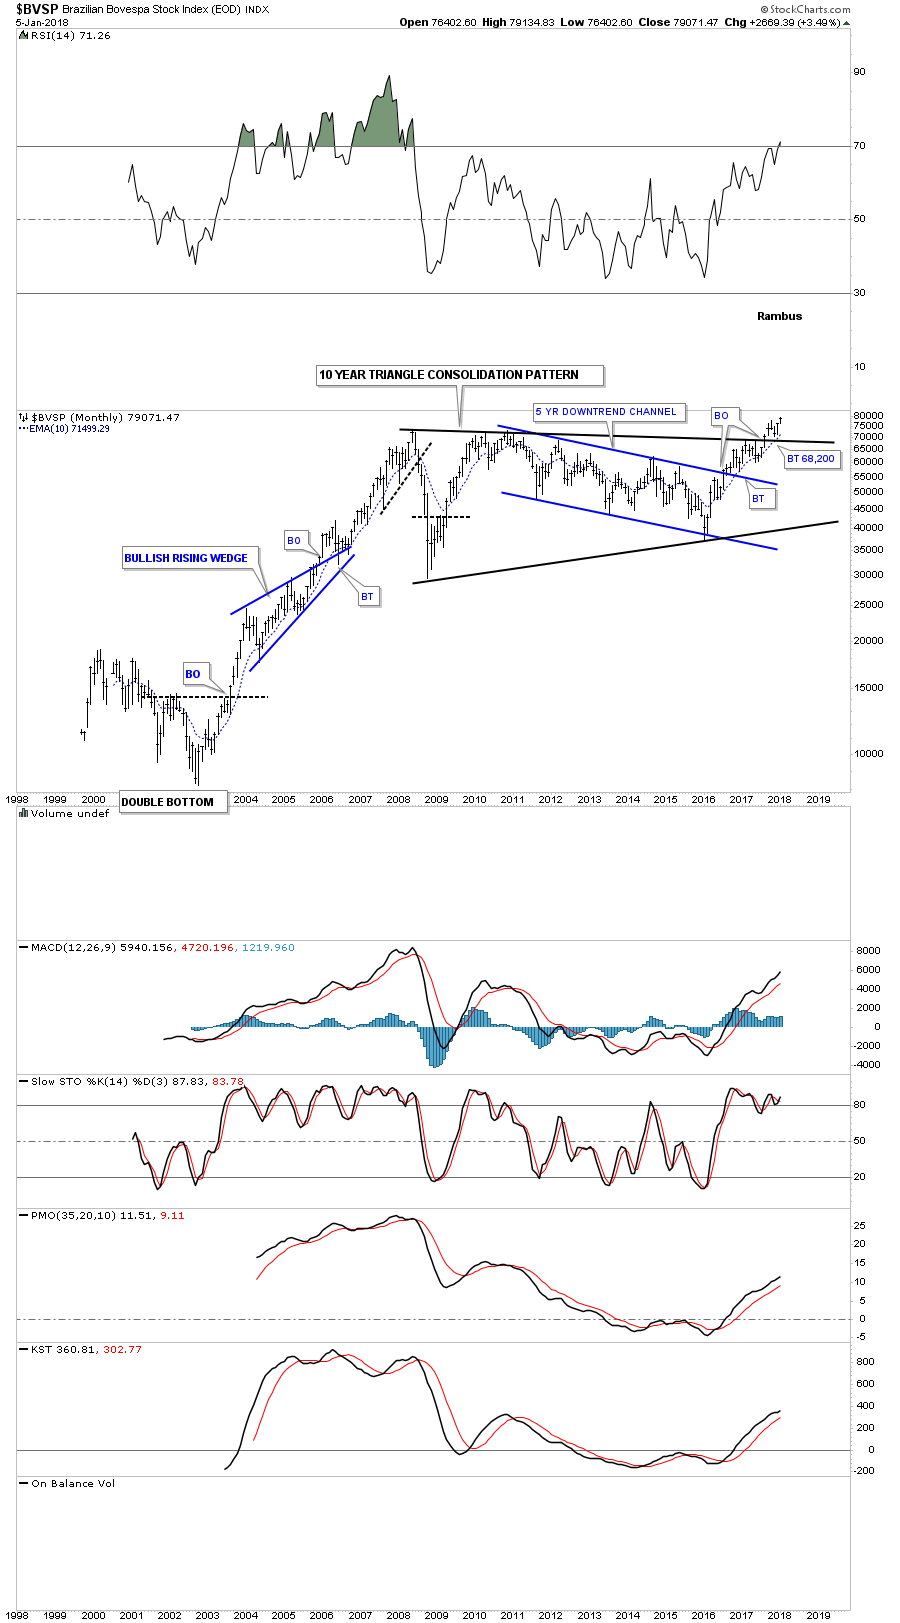
Below is a 20 year monthly chart for the $BVSP, Brazilian Stock Market, which is in the process of breaking out and backtesting the top rail of its 10 year triangle consolation pattern.
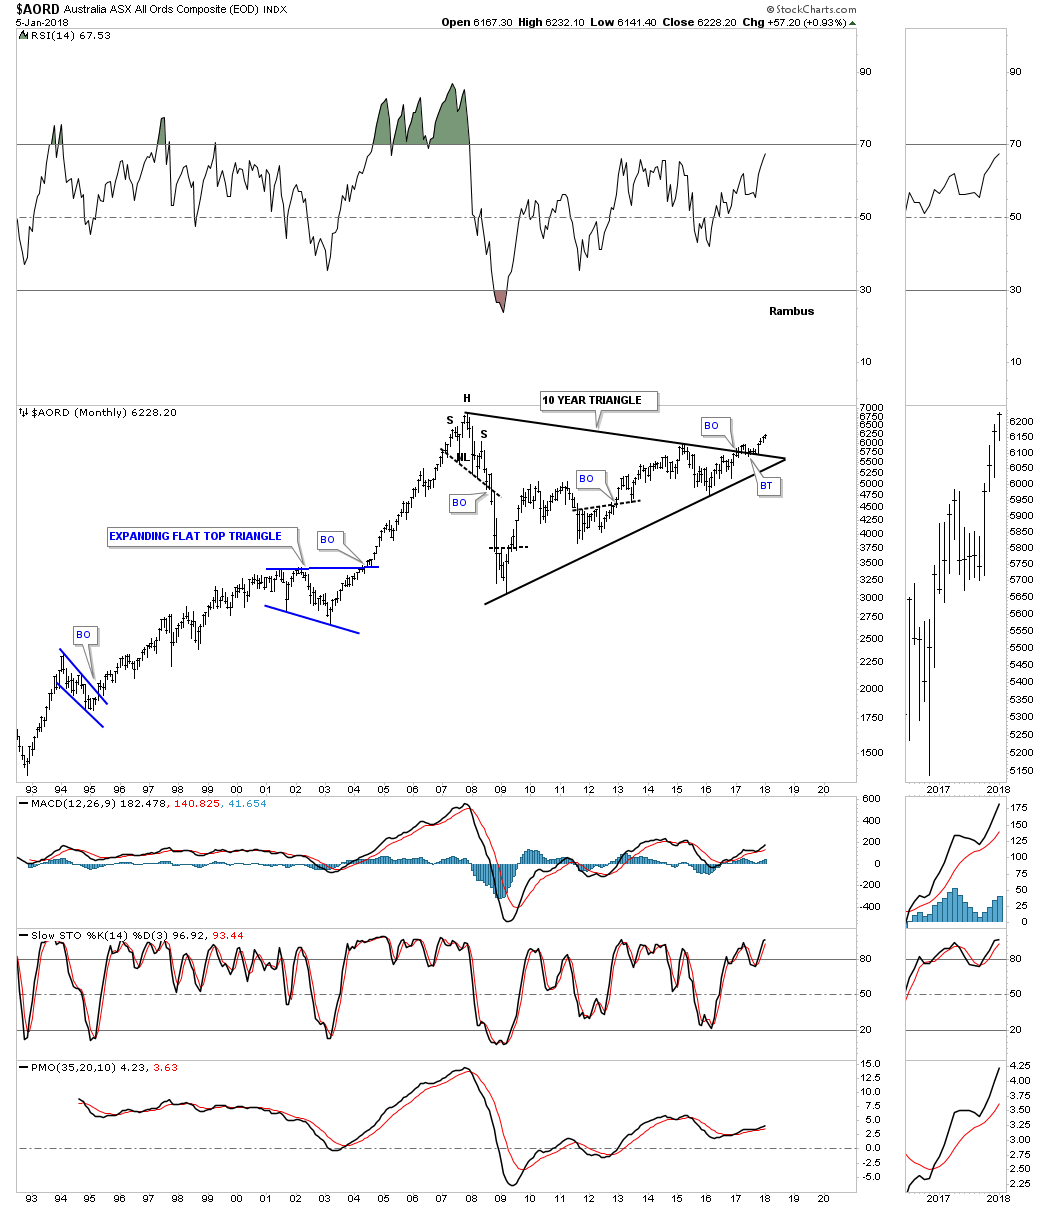
The $AORD, Australian Stock market is in the process of breaking out and backtesting the top rail of its ten year triangle consolidation pattern.
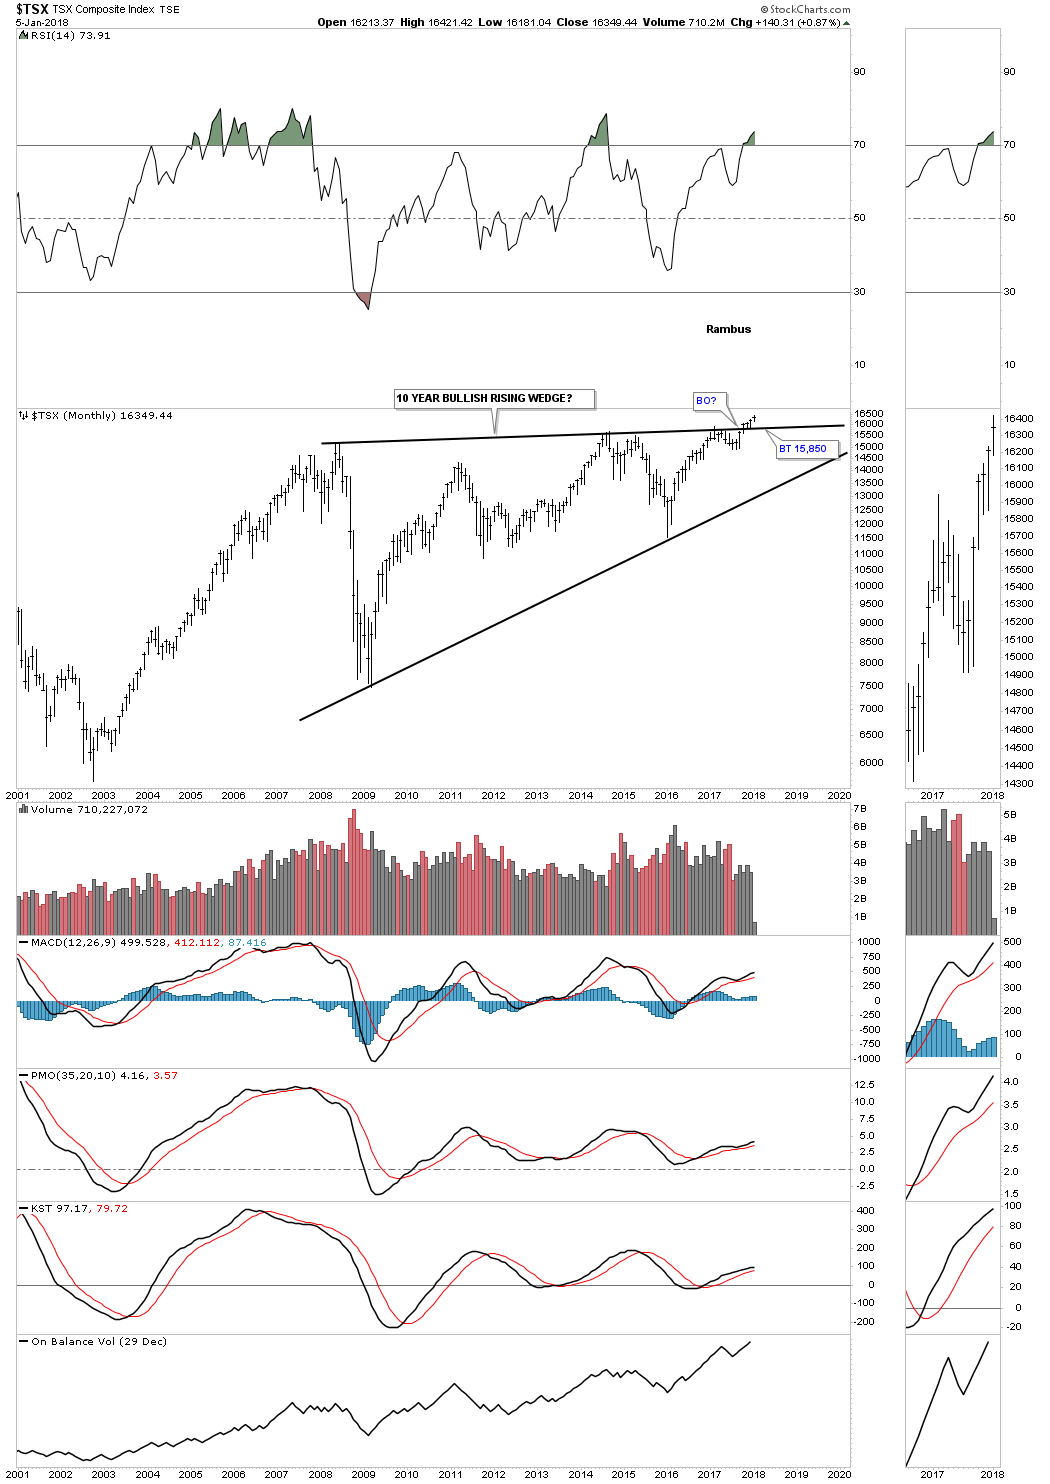
The long term monthly chart for the $TSX shows it to is breaking out and backtesting the top rail of its 10 year bullish rising wedge.
Lets look at some Asian stock markets to see if they are onboard for a worldwide secular bull market. The $NIKK topped out in 1998 and then began a 25 year bear market that formed a bullish expanding falling wedge. Since the breakout above the top rail in 2013 the NIKK built out a small H&S consolidation pattern as the backtest and is now breaking out of that pattern.

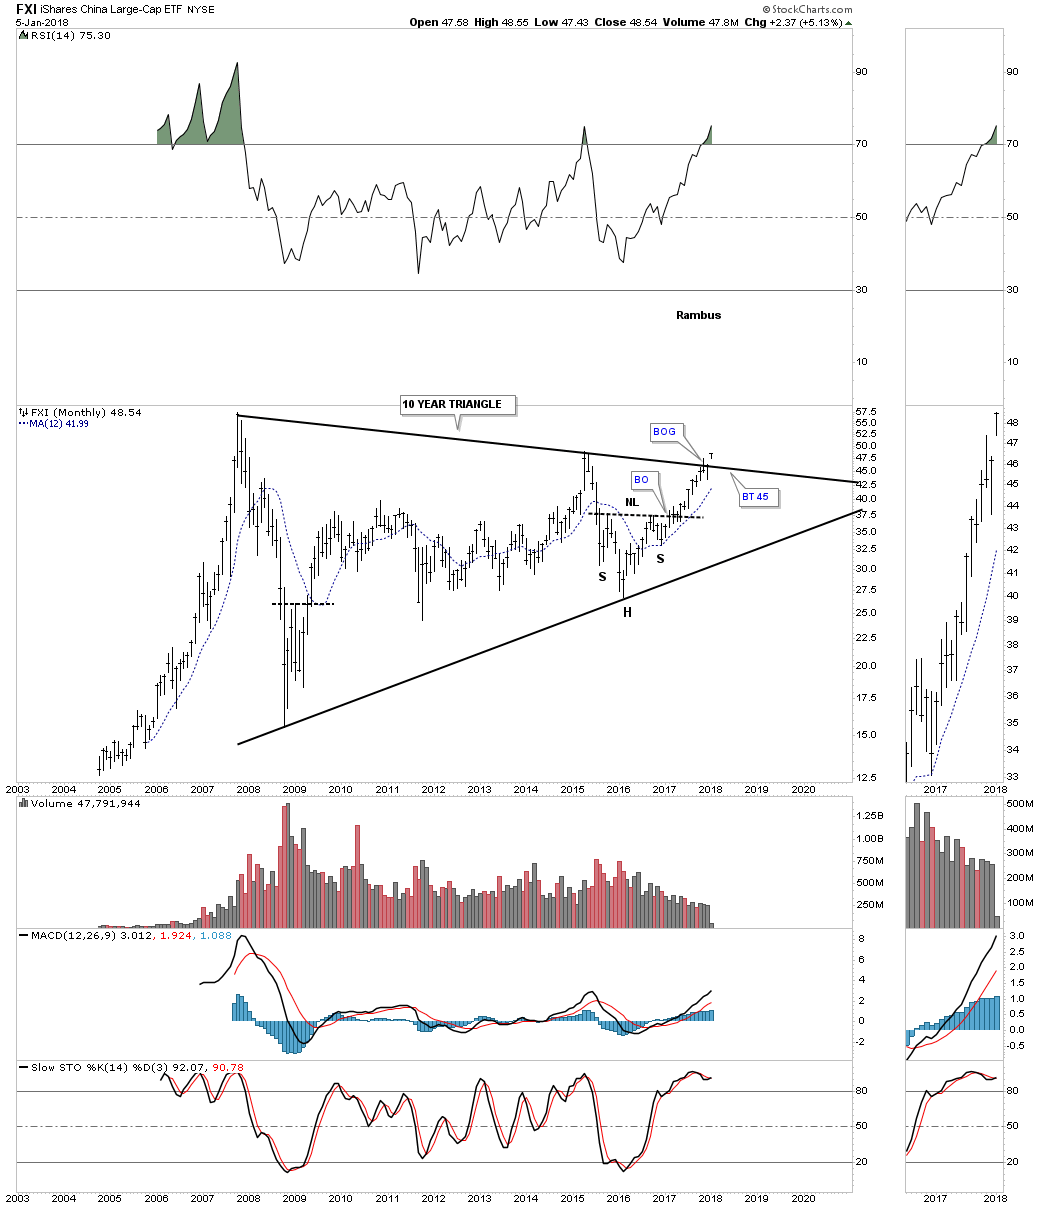
The FXI, China large cap etf, is currently breaking out from a 10 year triangle consolidation pattern with a breakout gap.
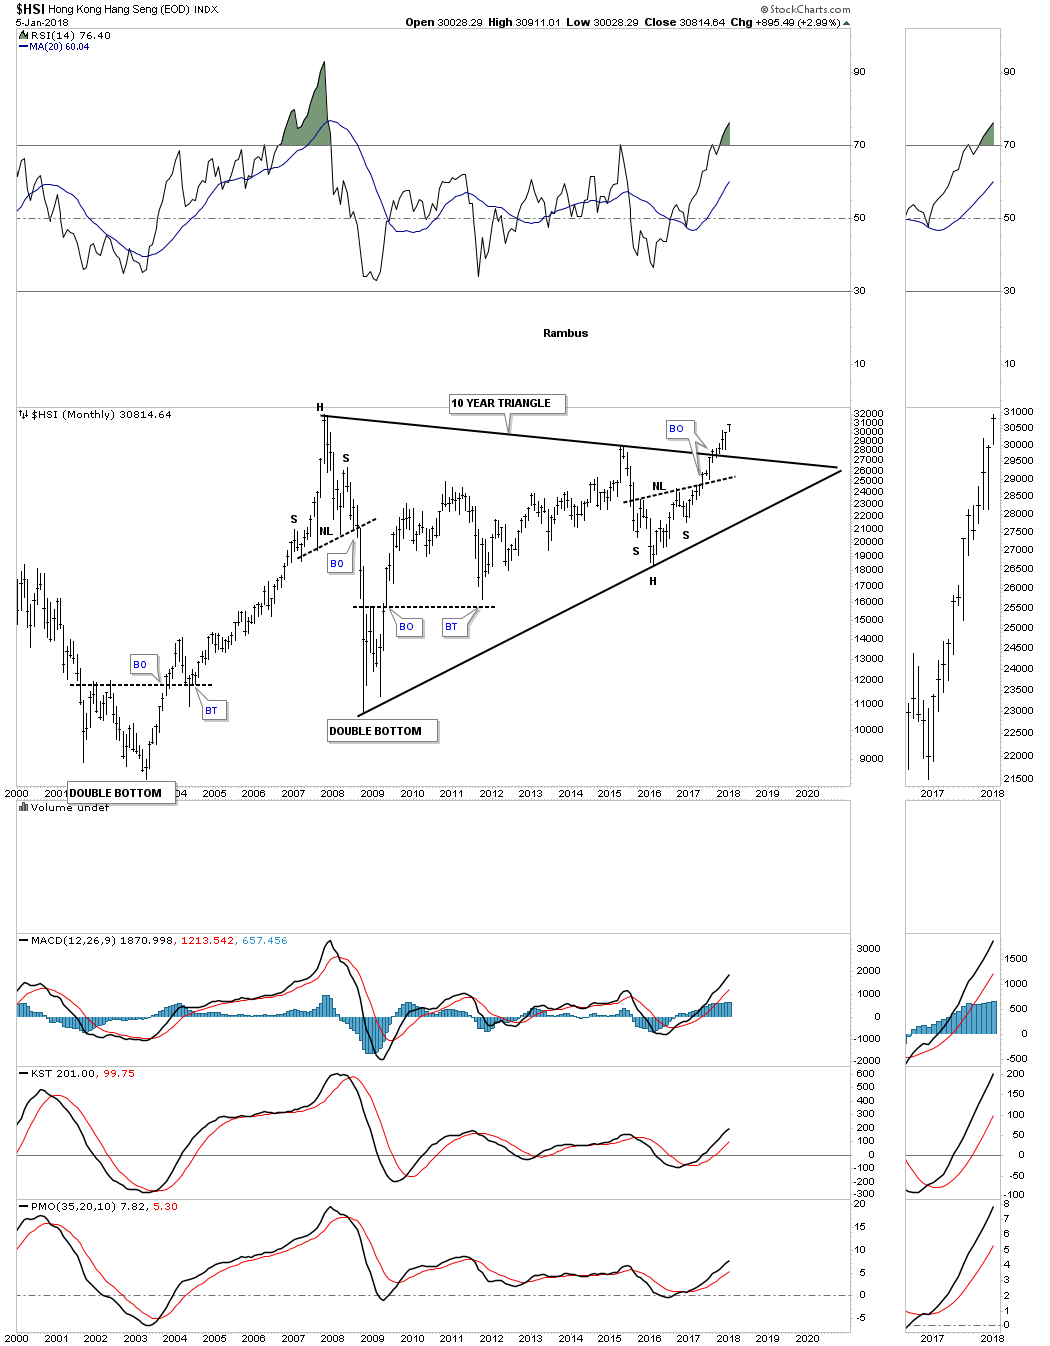
Below is a 20 year monthly chart for the $HSI, Hong Kong stock market, that is starting its four month of breaking out from its 10 year triangle consolidation pattern. Note the small H&S bottom at the 4th reversal point which was strongly suggesting the breakout above the top rail of the ten year triangle would take place.
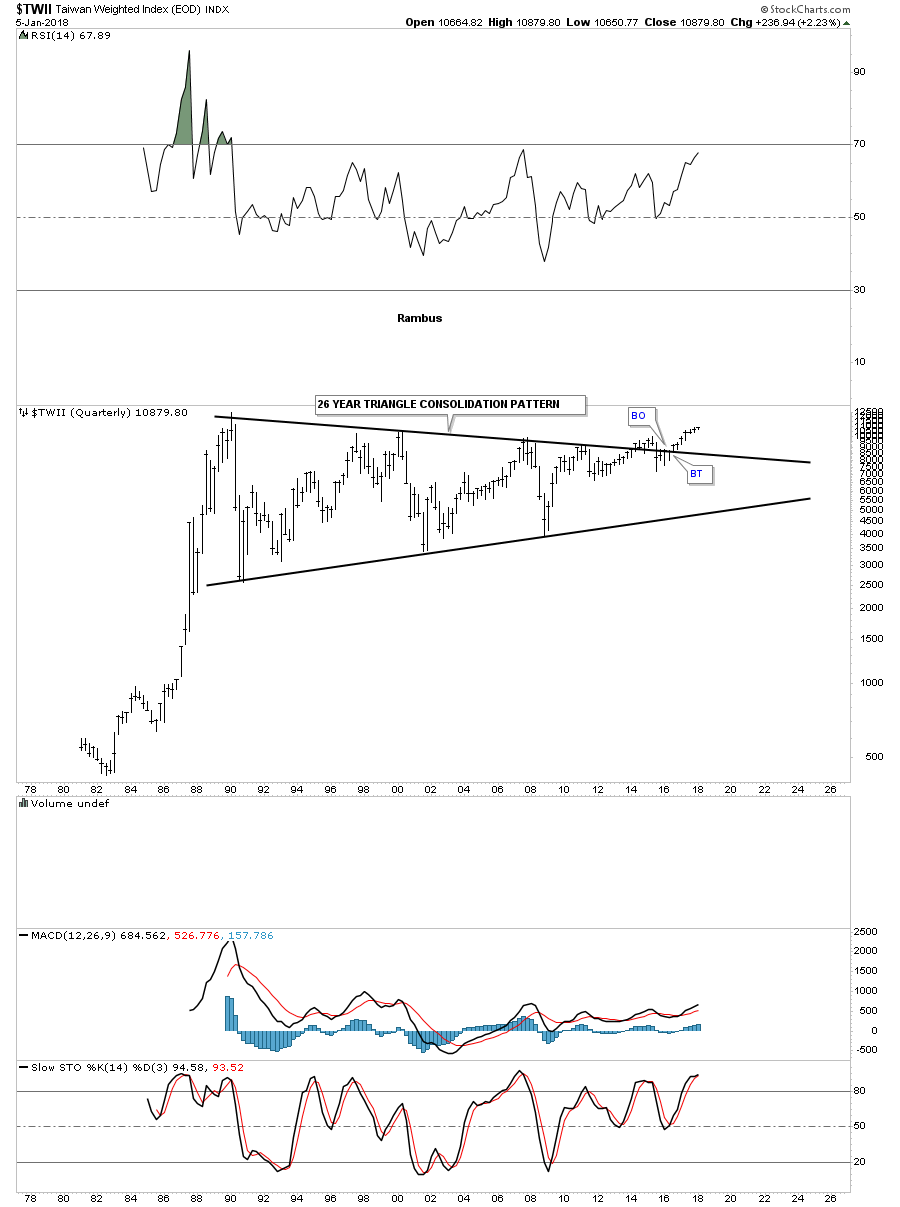
This last chart for tonight has one of the longest consolation patterns I’ve ever seen and I’ve seen a lot. Below is a 40 year monthly chart for the $TWII, Taiwan stock market, which has just recently broken out from a 26 year triangle consolation pattern after completing six reversal points.
This completes part one of this Special Weekend Report. I was hoping to get all the long term charts I’ve collected though the years into two posts, but it looks like it may take three posts to show you how the big picture is shaping up.
How one interpets these long term charts is their business. All I can do is show you what they mean to me and how the secular bull market that started in 2009 is unfolding before our very eyes. We’ve been following many of these charts for years now and nothing has changed to make me think the bull market is over, just the contrary. If anything, these charts enforce my belief that the secular bull market still has a long way to run yet as some of the world stock markets are just now breaking out from their massive consolidation pattern. I will post part two for the Wednesday Report. All the best…Rambus
Halfway There?: US & World Stock Market
Prepared on January 10, 2018In part two of this special Weekend Report we’ll look at some big chart patterns in other areas of the markets. Before we do I would like to follow up with just a few more charts on the world stock markets which will help to reinforce my opinion that most of the world is in a secular bull market. I know that is a strong opinion, but that’s what the charts are strongly suggesting to me especially some of the very big chart patterns that have built out.
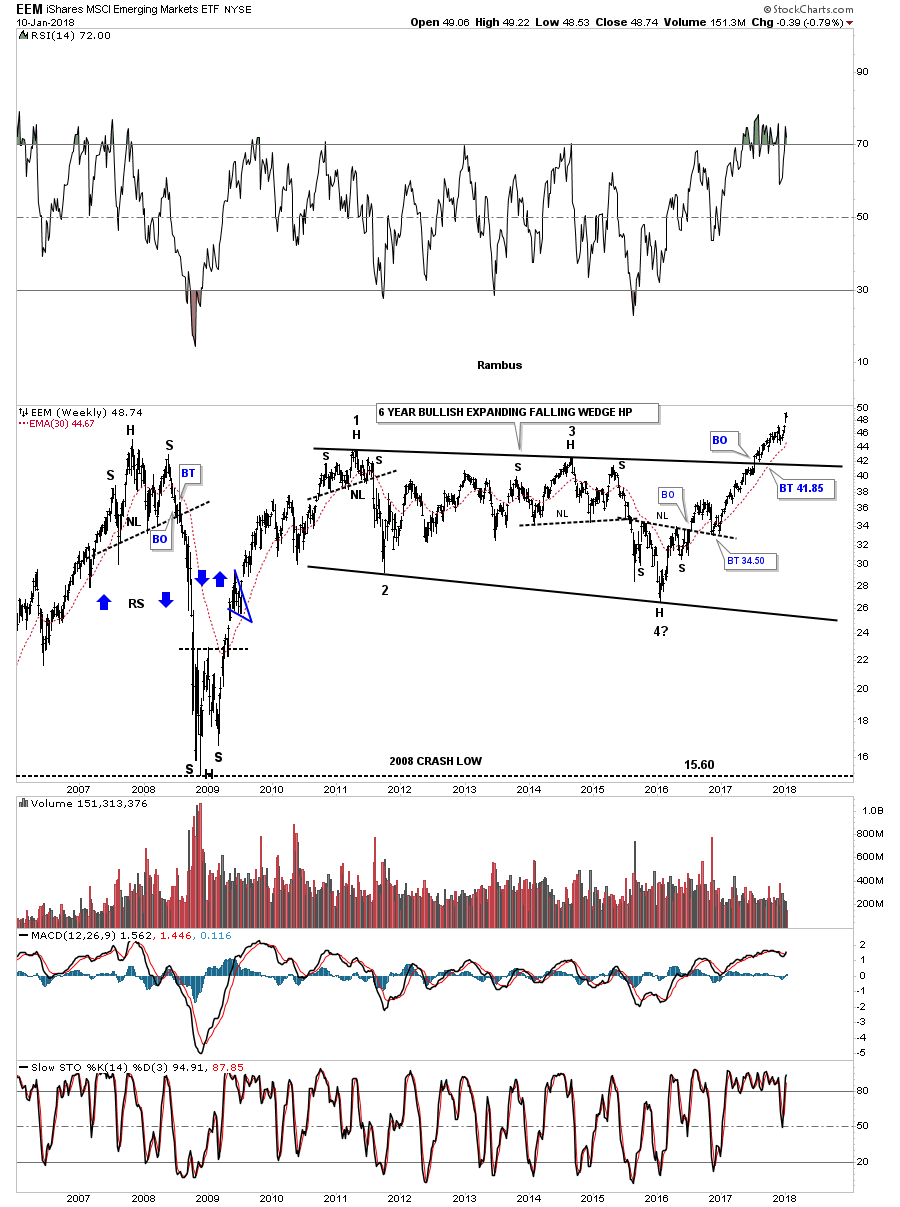
Lets start by looking at a 10 year weekly chart for the EEM, emerging markets etf, which built out a six year bullish expanding falling wedge consolidation pattern. It’s a bullish expanding falling wedge because the price action broke out through the top rail. In big chart patterns it’s common to see smaller reversal patterns at the reversal points. Reversal points #1, #3 and #4 each had a H&S reversal pattern. The most important one was the H&S bottom at reversal point #4 which gave us a big clue we would most likely see a breakout through the top rail.
Many times on big chart patterns the breaking and backtesting process can be very laborious, but in this case the breaking out and backtesting was very quick. It’s still possible we could get a backtest to the top rail, but in a strong impulse move the 30 week ema tends to hold support. Note the H&S top which formed back in 2007 that led to the crash in the emerging markets, similar to what happened to the rest of the world stock markets.
Now lets look at the long term 20 year monthly chart for the EEM which shows the entire history for this index. As we’ve discussed, big patterns are made up of smaller patterns. Here you can see the bullish expanding falling wedge that we just looked at on the weekly chart above is just part of the bigger ten year triangle consolidation pattern. On this ten year triangle the 4th reversal point is also the same H&S bottom on the weekly chart above. That shows you how important that one H&S bottom has been to the very big picture.
I’ve labeled the 10 year triangle as a halfway pattern because after a big consolidation period within the dominate trend, in this case up, that’s what these patterns tend to be. Note the strong bull market that was launched back in 2003 when the EEM broke out from that 3 year H&S consolidation pattern. How many times during that four year bull market did market analysis say, it couldn’t go up any higher because it was to overbought , the fundamentals were bad, or a host of other reasons that come out during a strong impulse move.
One last point on this 20 year chart for the EEM before we move on. During the bull market that began in 2003 each small high initially acted as resistance. and then reversed its role to support once it was broken to the upside. as shown by the black dashed horizontal lines. Also the 12 month sma held support on several tests, but the price action never closed the month below the 12 month sma. When you look at that bull market that began in 2003 and ran until 2007, ask yourself a simple question, could I have held on during those brief declines that lasted 2 or 3 months at the most? We have yet to see our first reaction high since this new leg up that began at the fourth reversal point in the ten year triangle.

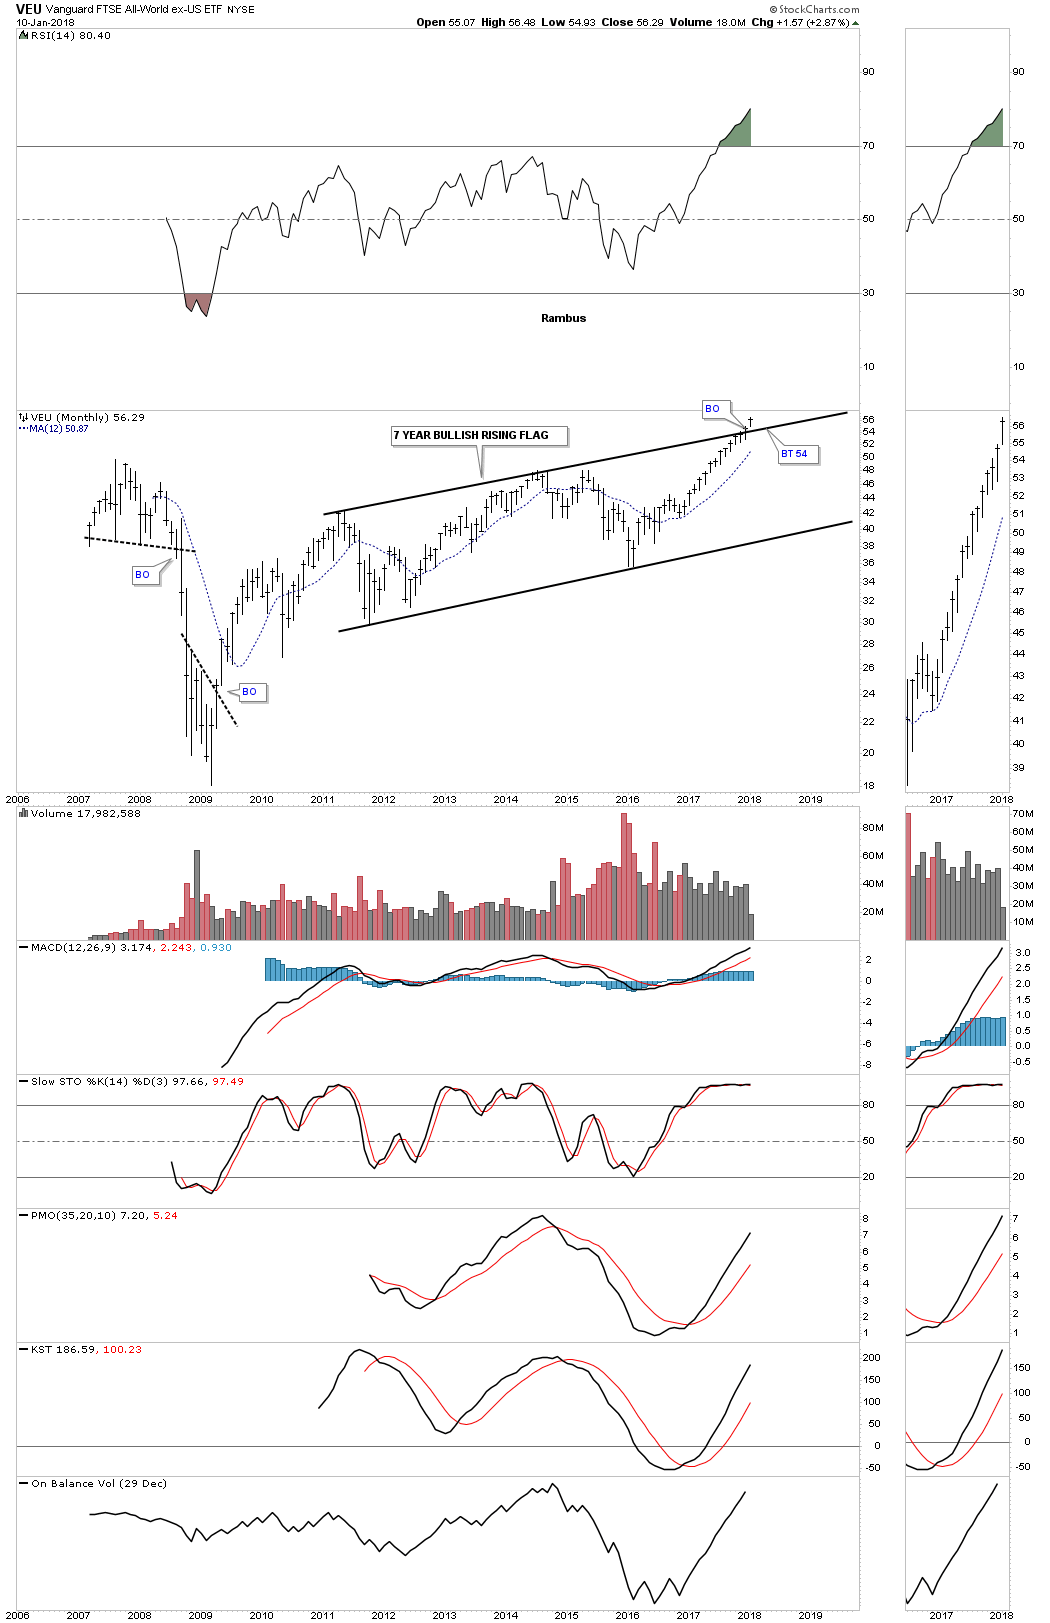
This next long term 20 year monthly chart is for the VEU, world stock markets ex the US stock market. This chart shows you how well the rest of the world is doing without the leverage from the US stock market. This month the price action is breaking out from a seven year bullish rising flag consolidation pattern. It’s very tiny but if you look on the sidebar you can see a small gap was made just above last months closing price which is where the top rail comes into play. Monthly gaps are very rare.
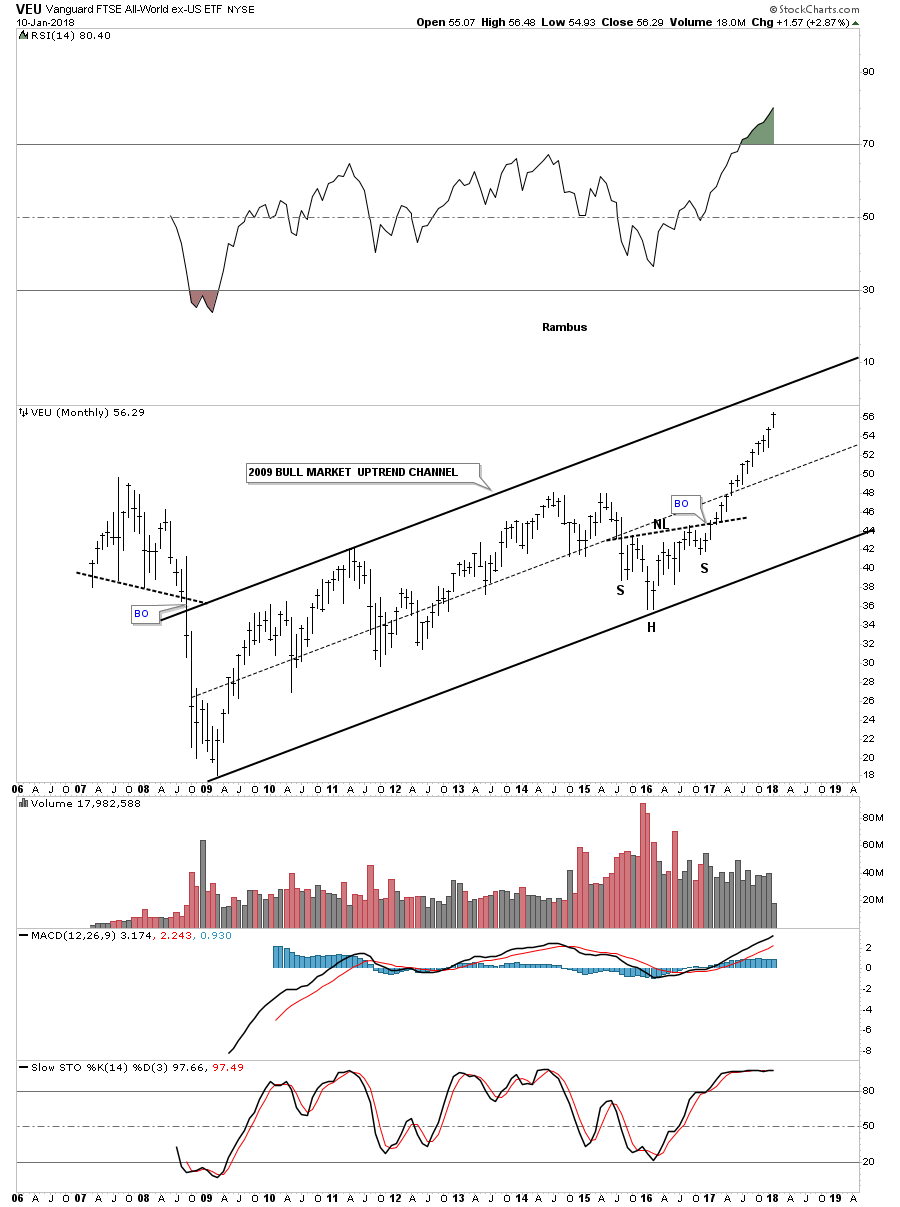
This last monthly chart for the VEU shows its 2009 bull market uptrend channel that just about every stock market on the planet is showing. In the case for the SPX it has broken above the top rail of its 2009 bull market uptrend channel.
Below is a monthly chart for the SPX which shows it has broken out above the top rail of its 2009 bull market uptrend channel and is in the process of doubling the original uptrend channel, as shown by the blue rectangle measuring sticks.

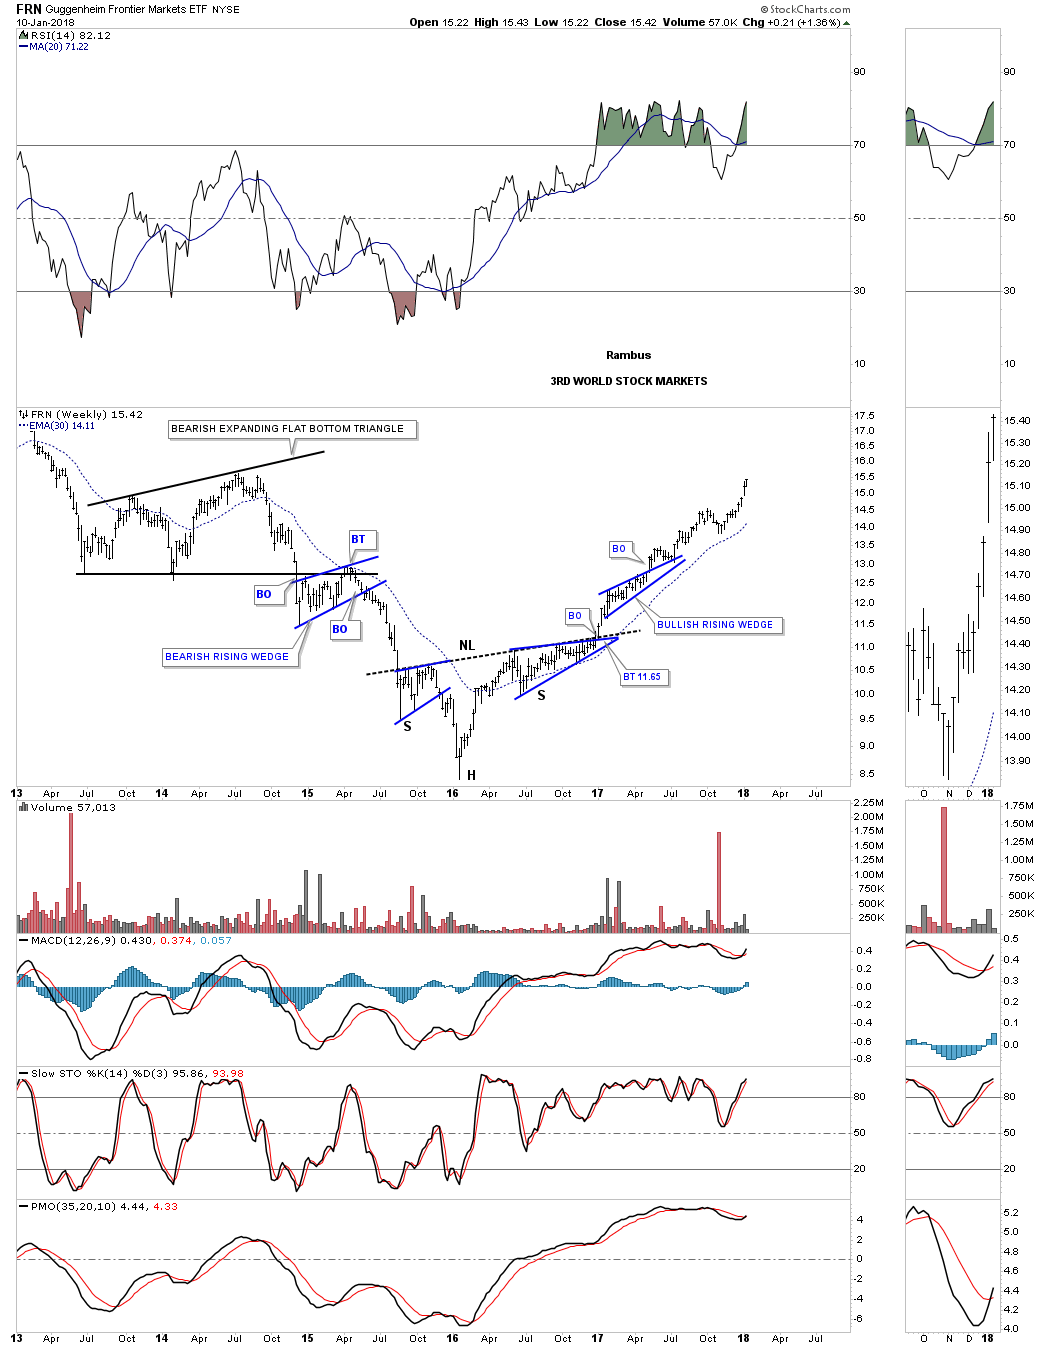
This last stock market index we’ll look at tonight is the FRN, Frontier Market etf, which is an index for the 3rd world stock markets. This five year weekly chart doesn’t have a big chart pattern on it, but it does show a very nice H&S bottom that we first looked at a year ago in January of 2017. I showed this chart for the Quarterly Report I do for Catherine Austin Fitts who is president of the Solari Report and was Assistance Secretary of US Department of Housing and Urban Development under Gorge Bush #1. The FRN was just breaking a year ago this moth.
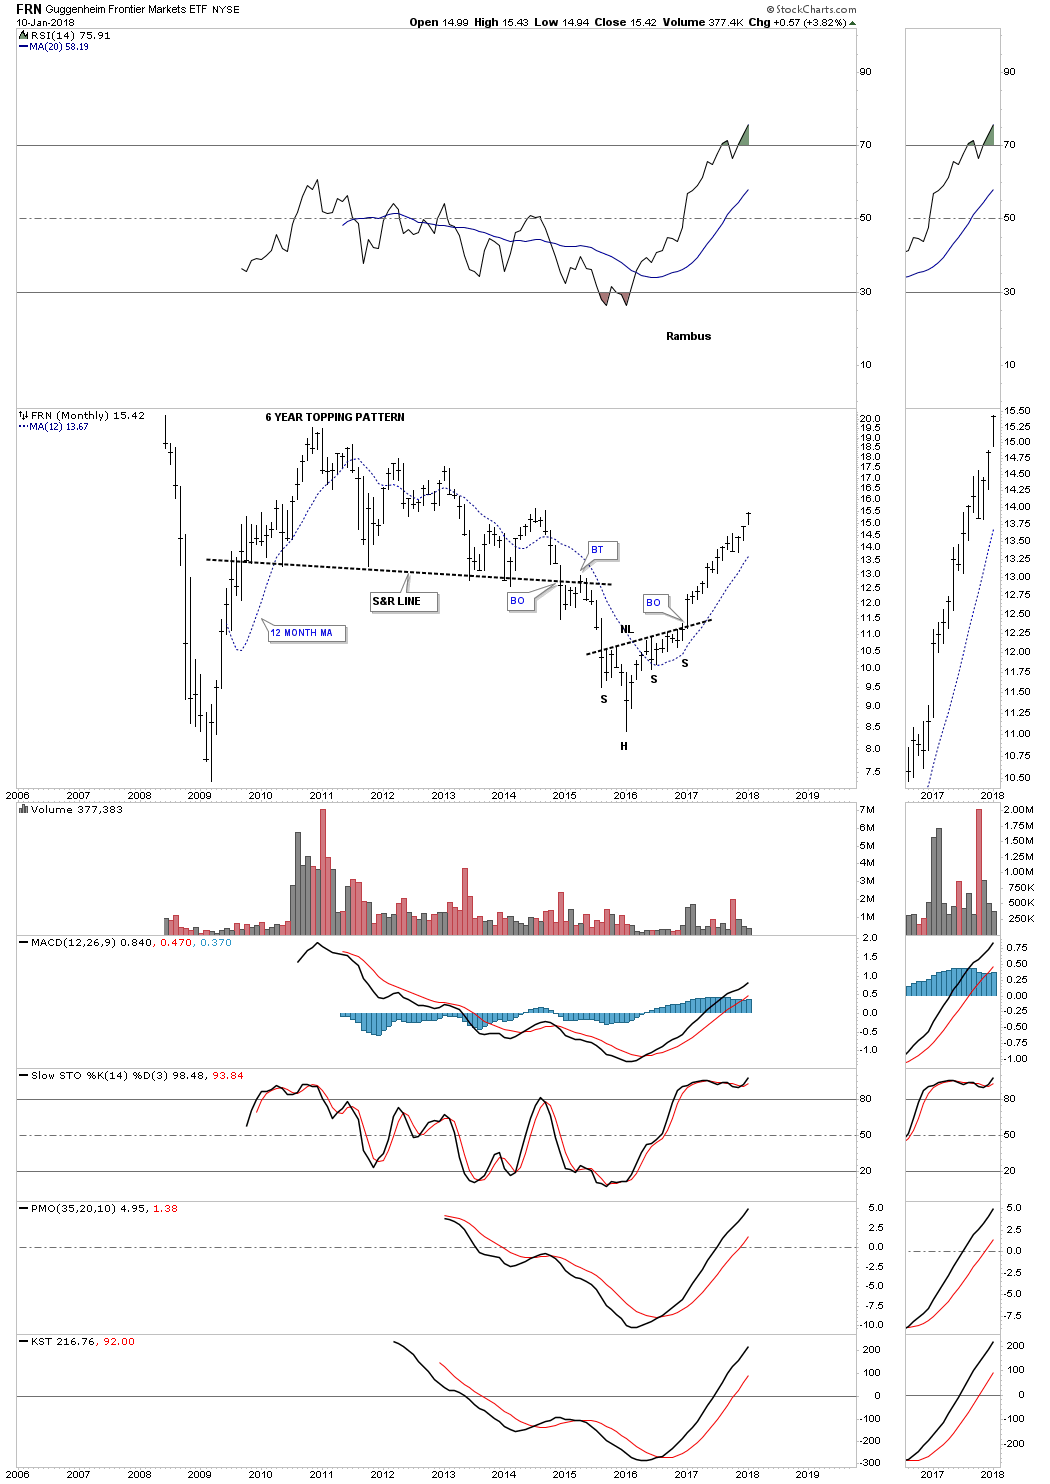
Below is a long term monthly chart for the FRN which does show a massive 6 year topping pattern. So far the 12 month ma has done a good job of showing support.
So far we’ve looked at most of the stock markets in the world from every angle including the US stocks markets, the European stock markets, the Asian stock market, the emerging stock markets, the world stock markets ex the US stock market, and even the third world stock markets. At this point in time I can’t find anything that is remotely bearish in any of the stocks markets we’ve looked at up to this point.
If the stock markets are in a secular bull market then there should be many different sectors that must also be in a secular bull market which are showing some very large chart patterns as well. Lets see if we can find some bullish sectors and see if they can give us any good clues.
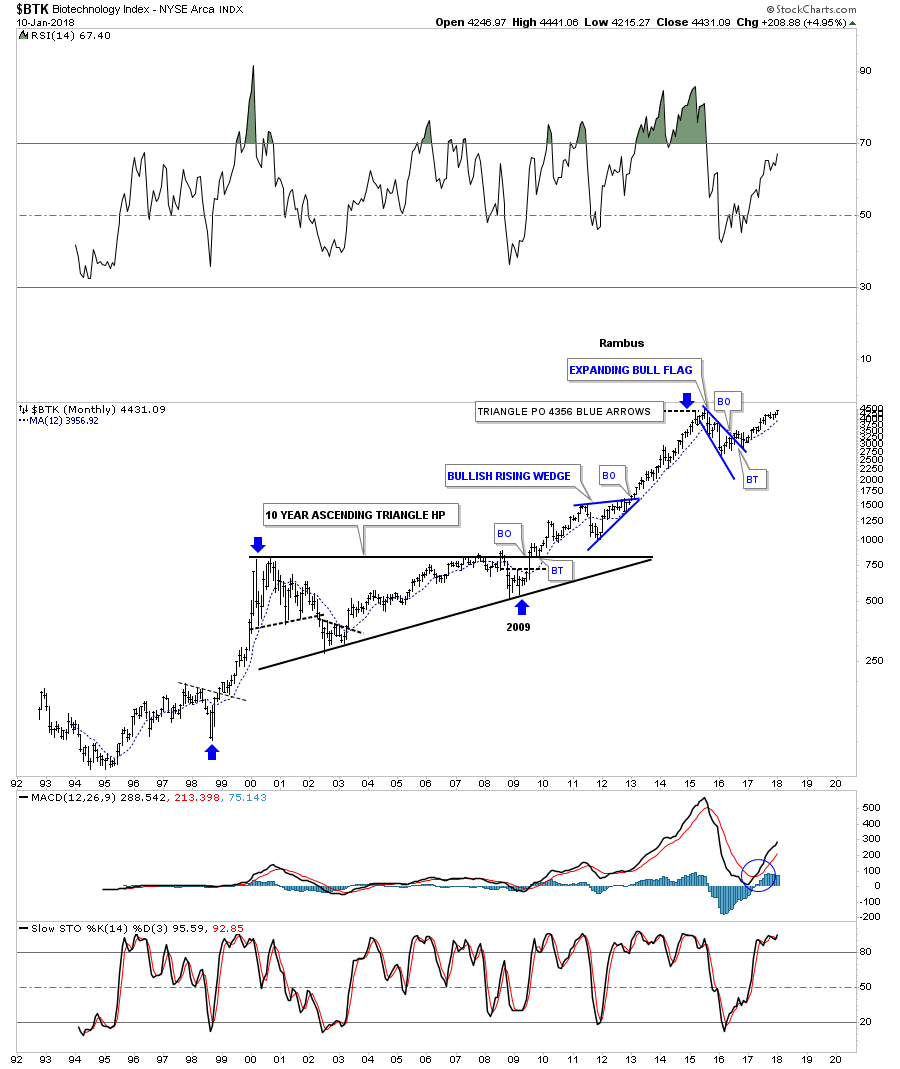
One of the strongest areas of the stock market was the $BTK, biotech’s. After forming a ten year flat top or ascending triangle the $BTK led the bull market out of the 2009 crash low until it topped in 2015. What was so impressive about that 10 year triangle consolidation pattern was the price action at the 4th reversal point. While most stock markets and individual stocks crashed hard into the 2009 crash low, making a lower low than the 2002 bear market low, the $BTK made a significant higher low in 2009. This was a big clue that the biotech’s were going to outperform most everything else, which was the case.
Note the measured move for the triangle halfway pattern as shown by the blue arrows. Of all the charts we’ve looked at up until this point, they are showing a similar halfway pattern that should show a similar type of rally leaving the big consolidation pattern as the rally leading into the consolidation pattern, in time and price. It’s not an exact science, but it does give us something to watch and monitor.
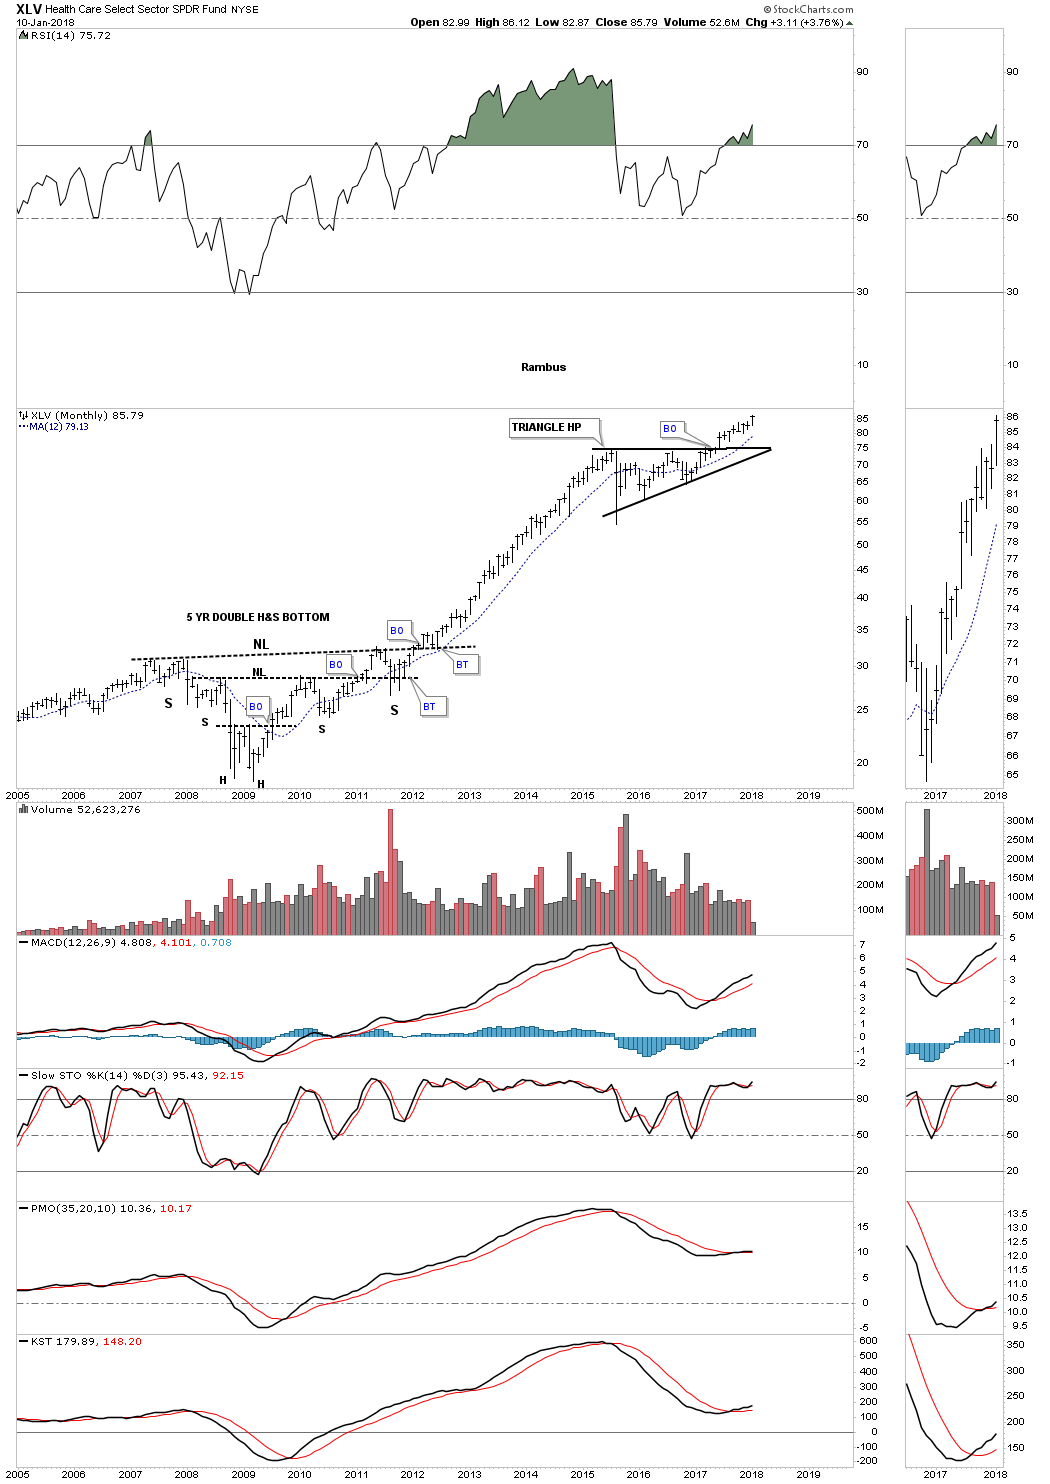
The XLV, health care etf, was another strong performer out of the 2009 crash low. It built out a five year double H&S bottom as its reversal pattern. After a very strong three year impulse move higher it was time for the XLV to take a rest. It rested by building out a two year triangle consolidation pattern which broke out eight months ago.
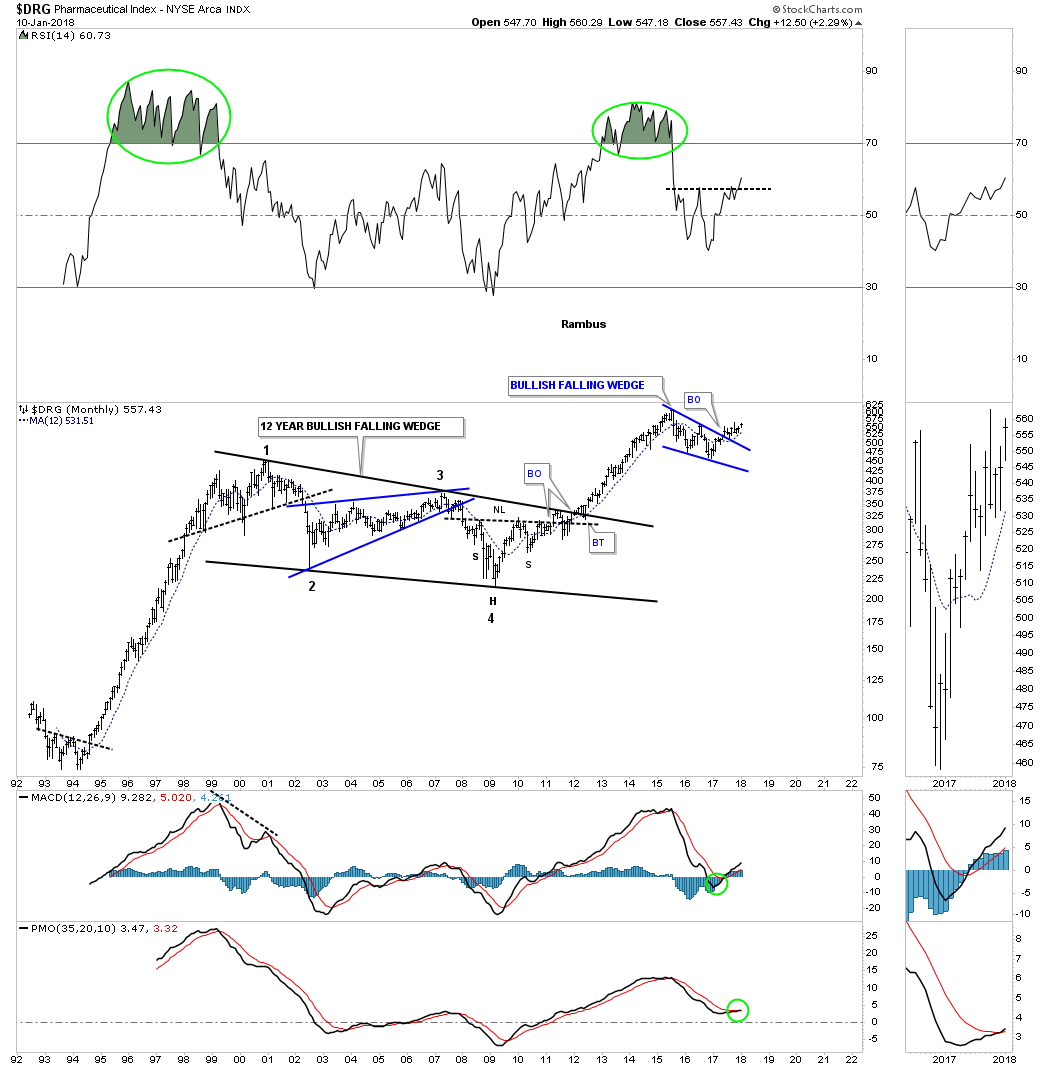
Next we have the $DRUG, Pharmaceuticals index, which built out a 12 year bullish falling wedge. Note how much lower the fourth reversal point is at the 2009 crash low vs the BTK we looked at earlier. There were three big patterns that built out the 12 year bullish falling wedge. About eight months ago the price action broke out of the latest consolation pattern, the blue two year bullish falling wedge.
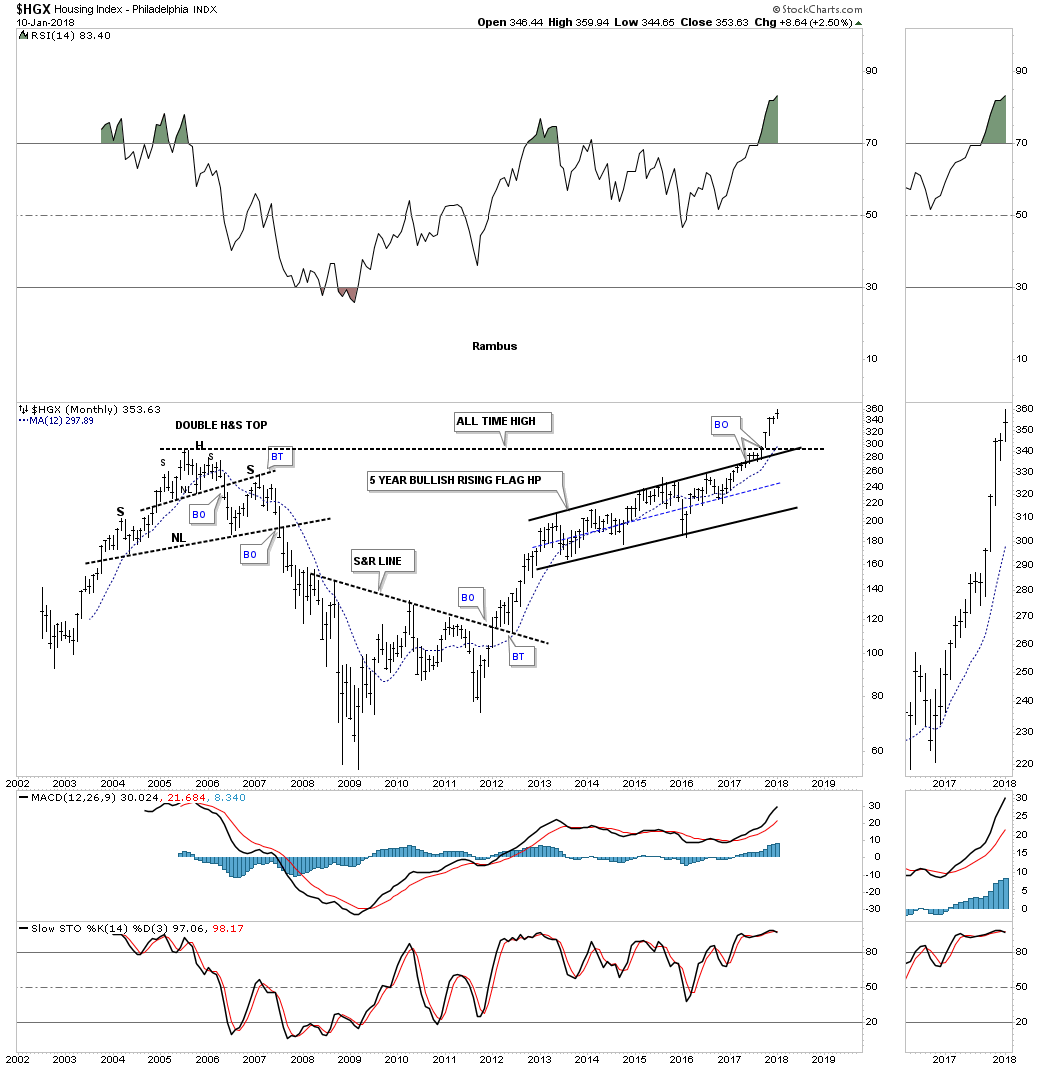
Another area that has been doing very well has been the $HGX, housing sector. This 16 year monthly chart shows three large chart patterns, two reversal patterns and one continuation pattern. The double H&S top actually began to buildout in 2003 with the formation of the right shoulder. The head formed in 2005 with the left shoulder in 2006 just before the crash. The bottom formation took nearly five years to build out which has led to our current bull market.
Beginning in 2013 the price action started to build out the five year bullish rising flag just beneath the all time highs, classic Chartology. If you compare our current price action to the 2007 H&S top they look nothing alike. Topping patterns that are going to reverse a bull market will take several years at the least to reverse such a strong trend.
Below is the XHB, homebuilders etf, which put in a massive H&S bottom in 2009 to reverse its bear market. The first consolidation pattern to buildout is the four year eight point diamond consolidation pattern. So far there is nothing not to like about this chart.

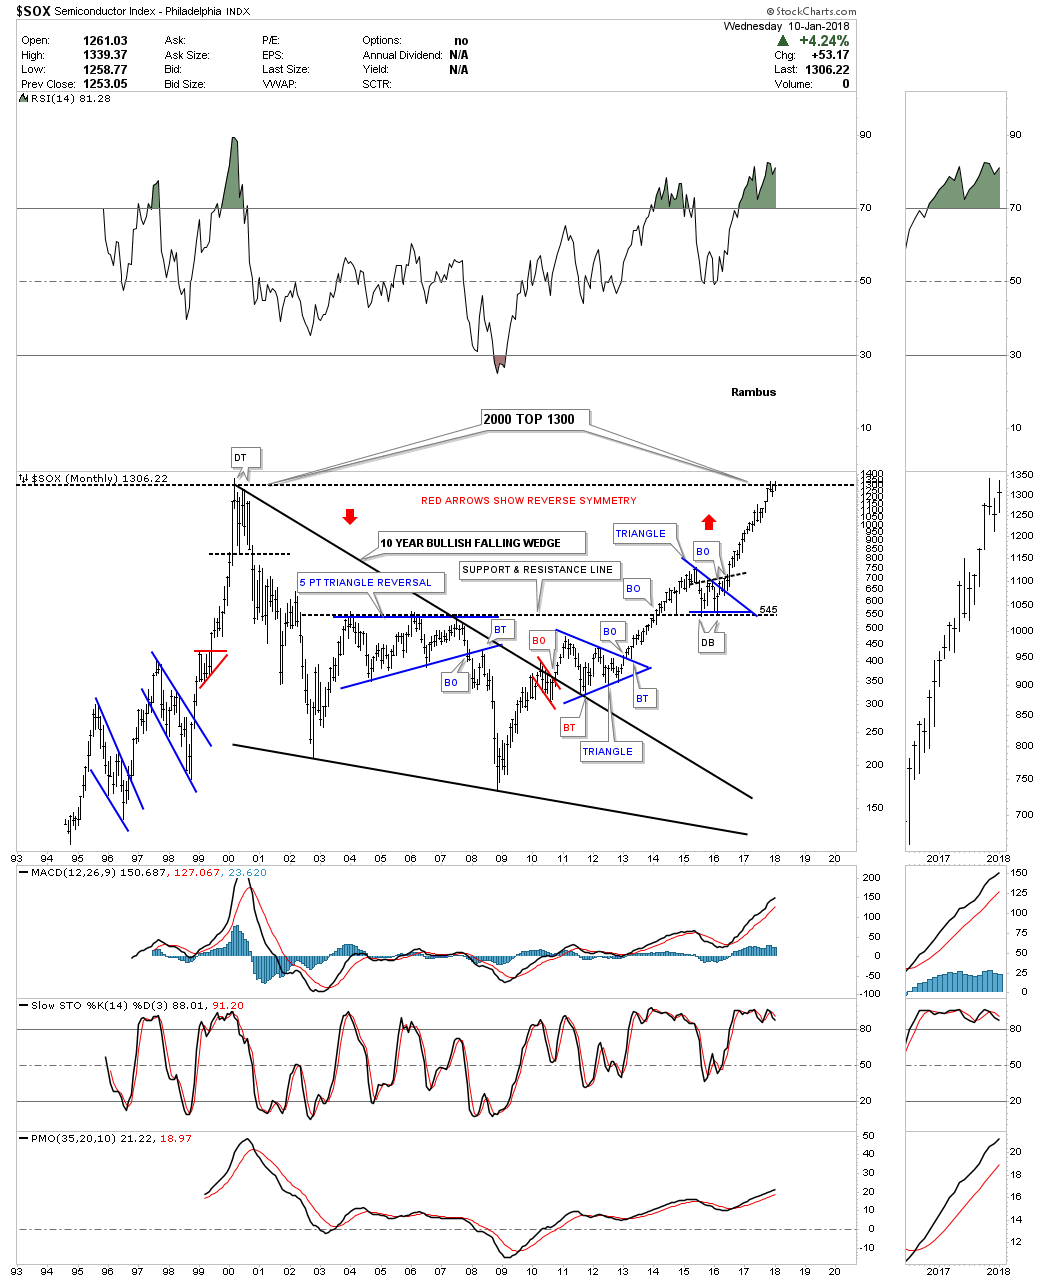
One of the strongest areas in the tech sector has been the $SOX, semiconductor index. This long term monthly chart is a little busy because it has so much beautiful Chartology on it. First note the big ten year black bullish falling wedge consolidation pattern. The breakout above the top rail was accompanied by a two year triangle consolidation pattern as the backtest. Note how well the black dashed support and resistance line held support once it was broken to the upside. A small blue triangle formed the last backtest at the 545 area. The red arrows shows how I was looking for reverse symmetry to the upside vs how the price action declined off the 2000 all time high top.
I’ve been suggesting that we should see some type of consolidation pattern build out just under the 2000 all time high around the 1300 area. If you look at the sidebar you can see how the price action hit the all time high two months ago and had a small reaction back down. This month the $SOX is attempting to test the all time high again. We may see one more retreat from the all time highs before a complete four point consolidation pattern can finish building out.
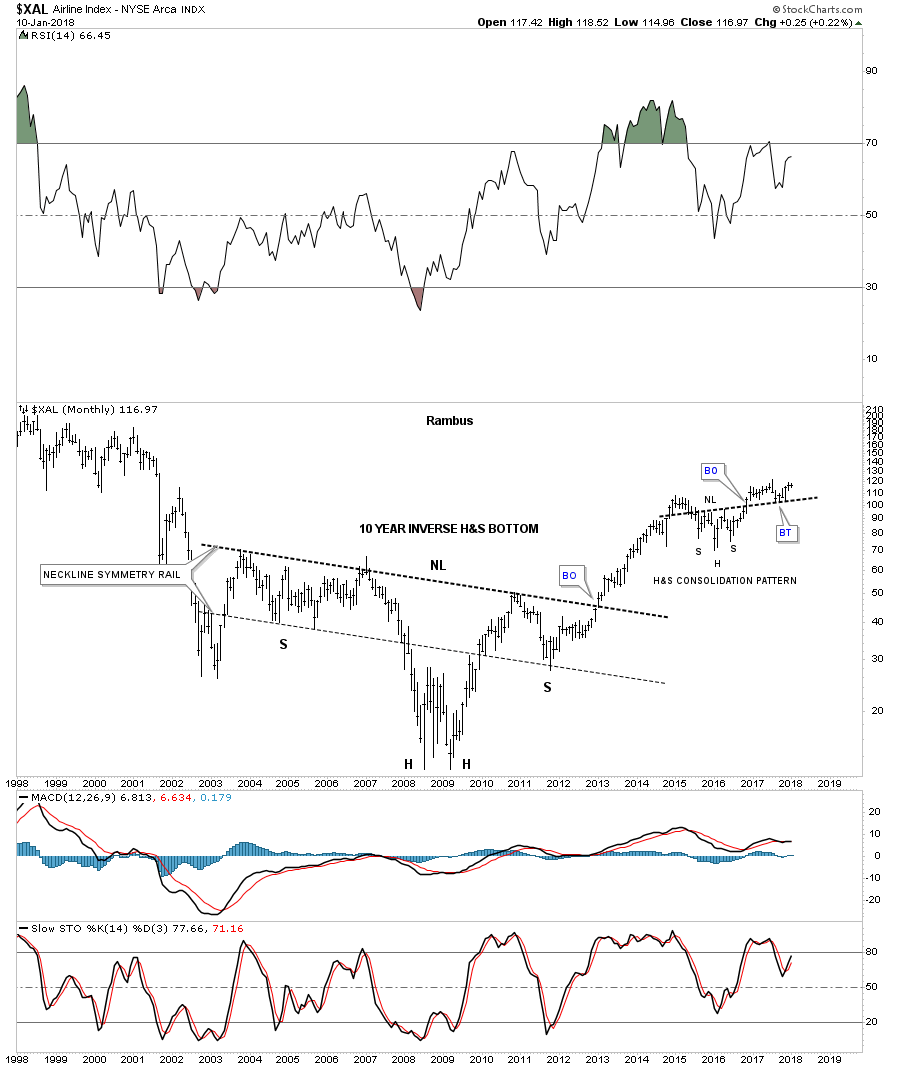
Another area that is looking good again is the $XAL, airline index, which built out a ten year H&S reversal pattern with the head forming in 2009. After the initial impulse move out of the H&S bottom the $XAL needed to consolidate its gains in 2014 where it began to build out the two year H&s consolidation pattern. It now looks very possible that the backtesting process may be coming to an end and the next impulse leg up is at hand.
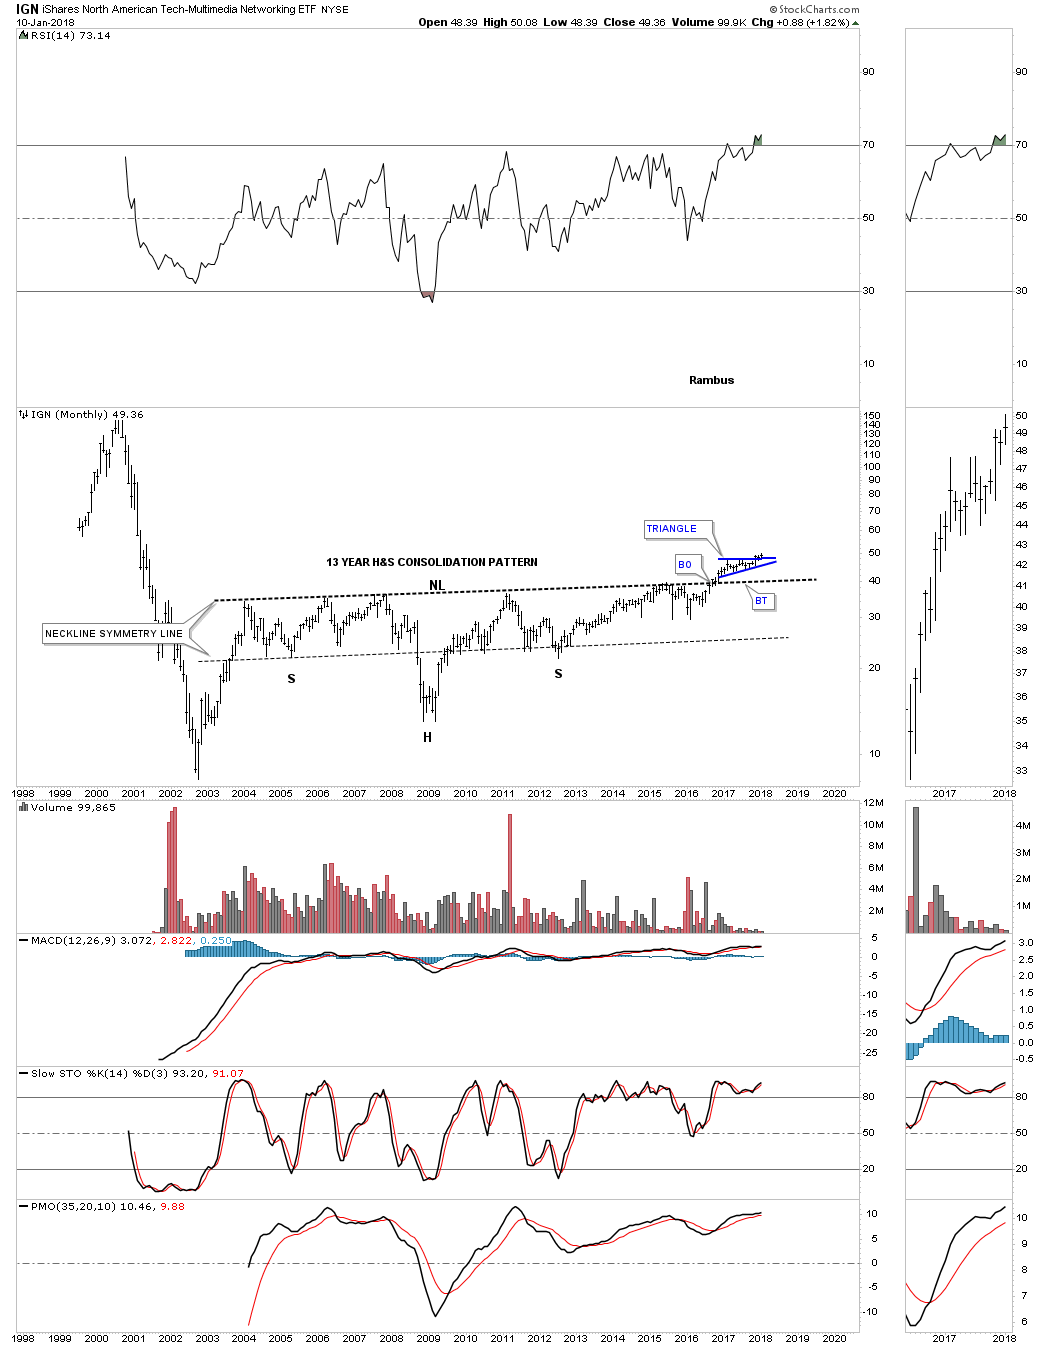
The IGN has built out a massive 13 year H&S consolidation pattern with the breakout above the neckline about a year ago. Since the breakout, the price action has been building out the blue triangle consolidation pattern as its first consolidation pattern. Note how steep the decline was from the 2000 all time high on the left side of the chart. The current setup is similar to what we were looking at when the $SOX was just breaking out. Is it possible we could see some reverse symmetry back up over the same area as the decline?
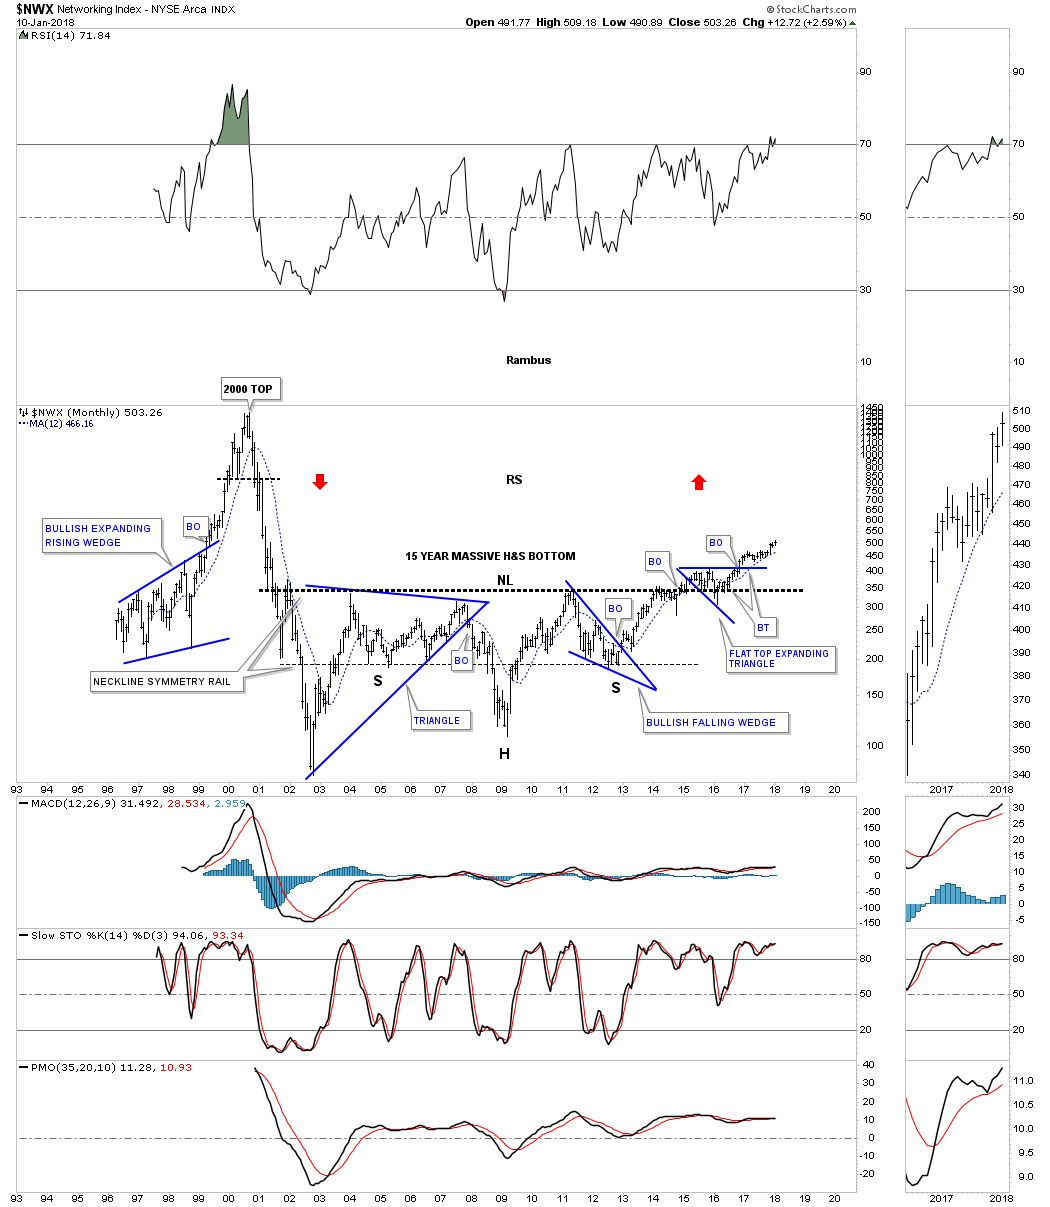
Another area in the tech sector that looks like it may be getting ready to move higher is the $NWX, networking index. This index built out a massive 15 year H&S bottom with the breakout coming in 2015 or so. It is not at all unusual to see a consolidation pattern form on top of a very strong trendline. The $NWX is now trading at a new high not seen since the decline that began in 2000. Will this sector play catchup?
This special report has gotten bigger than what I was originally intending. It looks like I’m going to have to do a part three to get everything covered. There is so much to cover and so little time. I’ll get part three out as soon as possible. All the best…Rambus
Big Patterns: US Dollar, Bonds, & Commodities
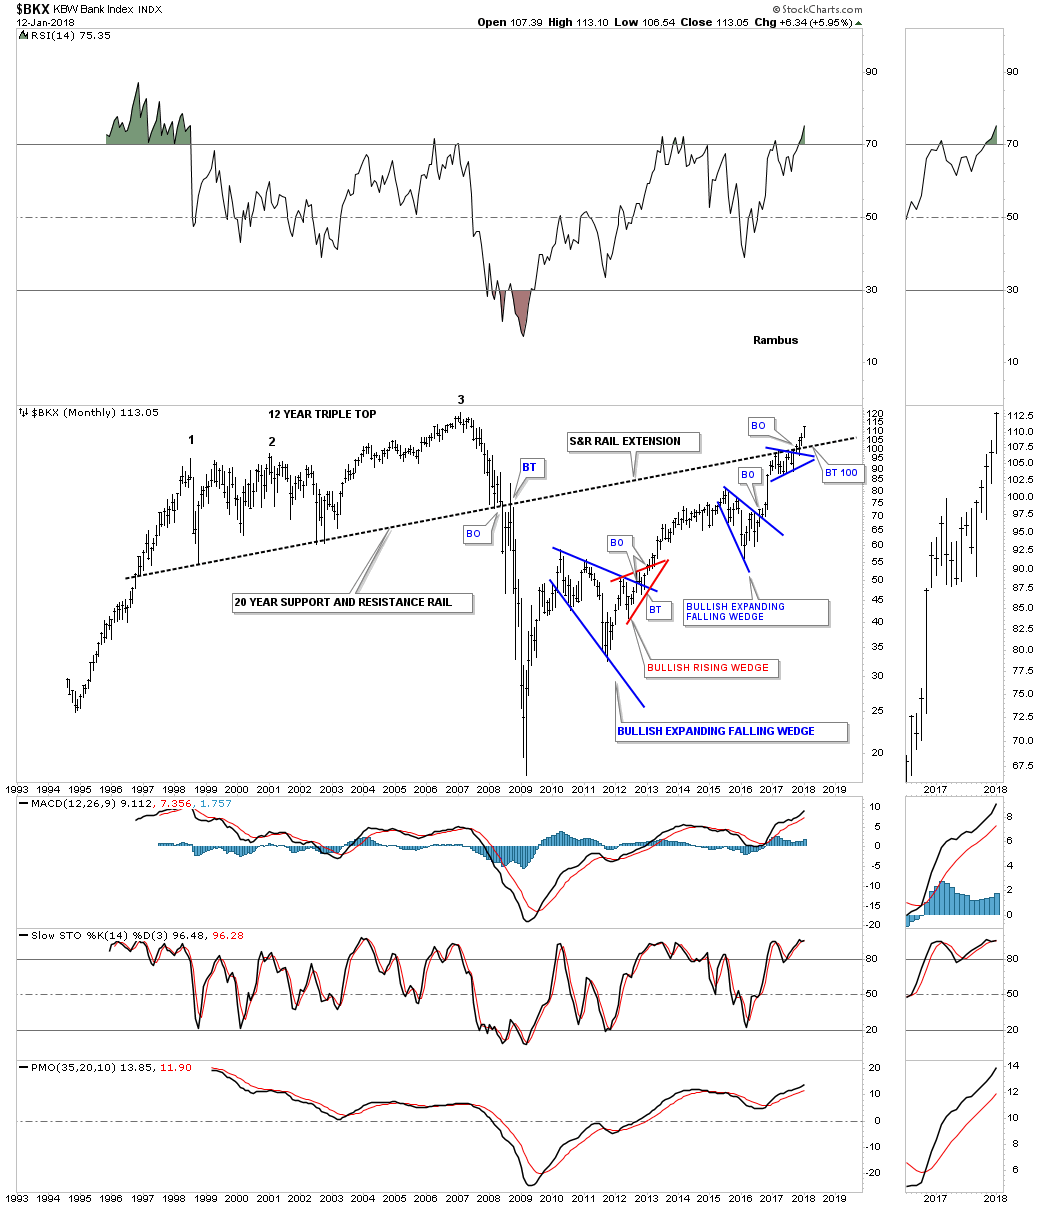
Prepared on January 15, 2017As we have a ton of charts to look at lets get started by looking at the $BKX, Bank index. If one had been following this 25 year monthly chart in the early to mid 2000’s, the banks looked very strong with no signs of trouble. One would have constructed a bottom support line taken from the 1998 and 2002 lows which gave you a good line in the sand. Until the price action started to breakdown from the third top there was no reason for concern, but the further the price action fell the more important the triple top trendline or as I’ve labeled it the 20 year support and resistance line became. The $BKX tested the S&R line for four months before it gave way. Remember big chart patterns lead to big moves.
The price action then backtested the S&R line for four more months from below before the actual crash began. You would have had plenty of time to exit any long positions you may have had at the time before it was too late. There was plenty of other evidence that something big was going to occur back then as the stock markets were also showing a H&S top during that time.
There is an old expression in Charting that says, “an important trendline never dies it just slowly fades away.” The reason I call the triple top trendline a 20 year support and resistance line is the fact that it’s still currently in play. As we’ve discussed previously it’s not uncommon to see a small consolidation pattern form just below an important trendline, that gives the stock the energy it needs to finally overtake that overhead resistance, in this case for the $BKX. In the first half of 2017 you can see the small blue triangle that built out just below the 20 year S&R line. Three months ago we got a double breakout, first the 20 year S&R line and secondly the top rail of the small blue triangle. What is also still possible is that we could see another small consolidation pattern build out on top of the S&R line before the actual impulse move begins in earnest. The bottom line is the 20 year S&R line is a perfect line in the sand, above is bullish and below is bearish.
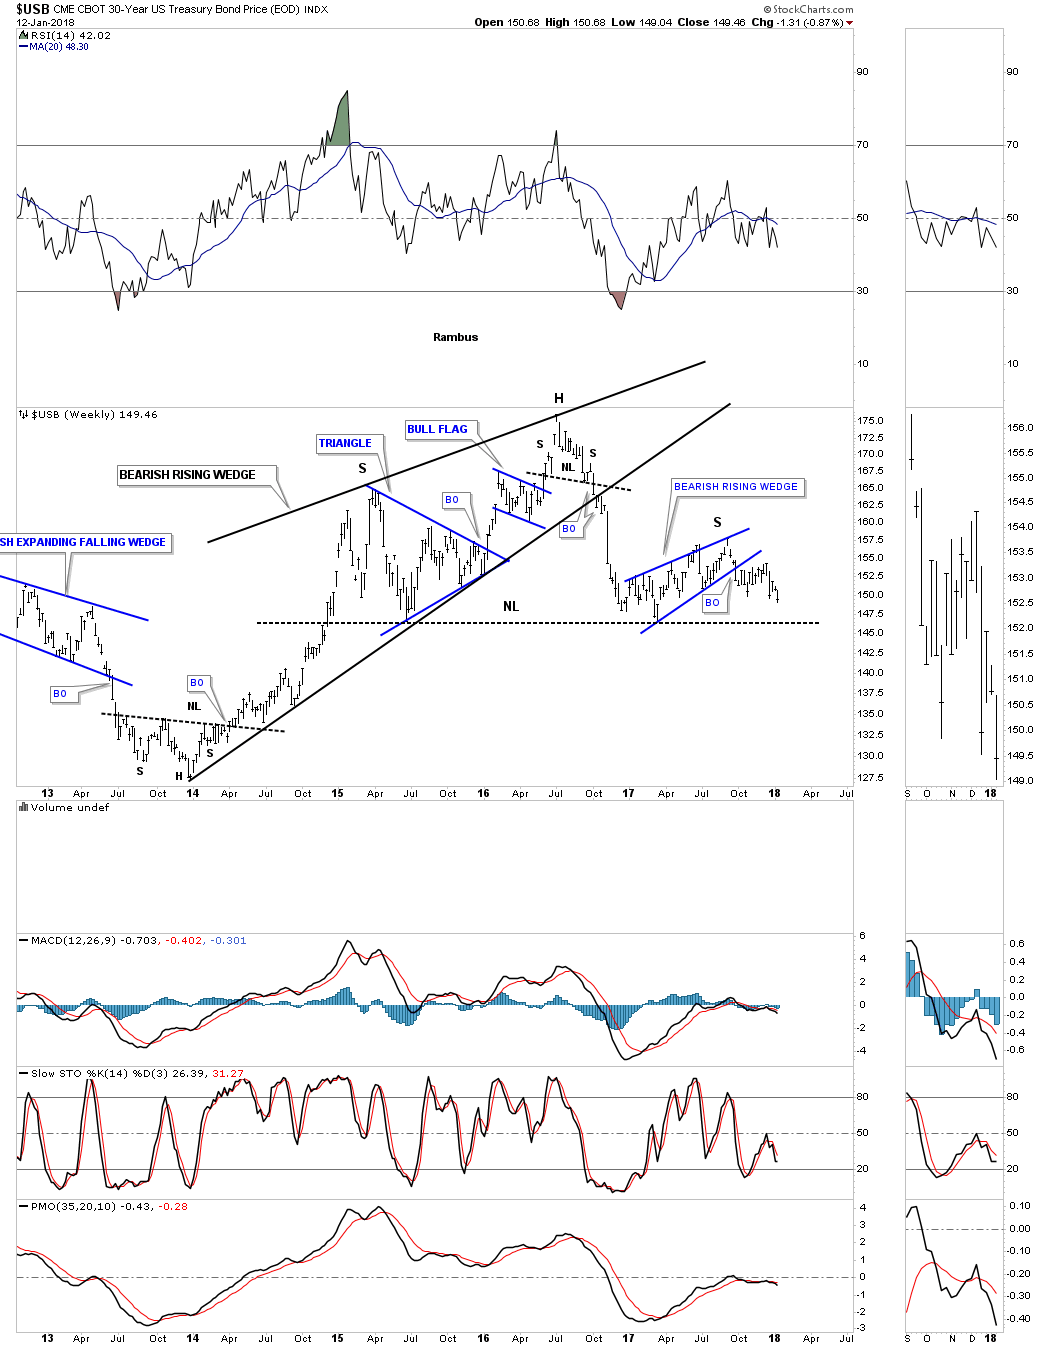
Next I would like to show you a five year weekly chart for the $USB, 30 year treasury bond, that I’ll use as a proxy for most of the other bonds that are showing a similar setup taking place. This weekly chart shows a 2 1/2 year bearish rising wedge that broke down in mid 2016 which began its first impulse leg down in its new bear market. The first reaction low from the initial breakout built out another bearish rising wedge which is the right shoulder of the 2 1/2 year H&S top. The H&S top won’t be completed until the neckline is actually broken to the downside, but by looking at other markets it sure looks like this H&S top is going to play out.
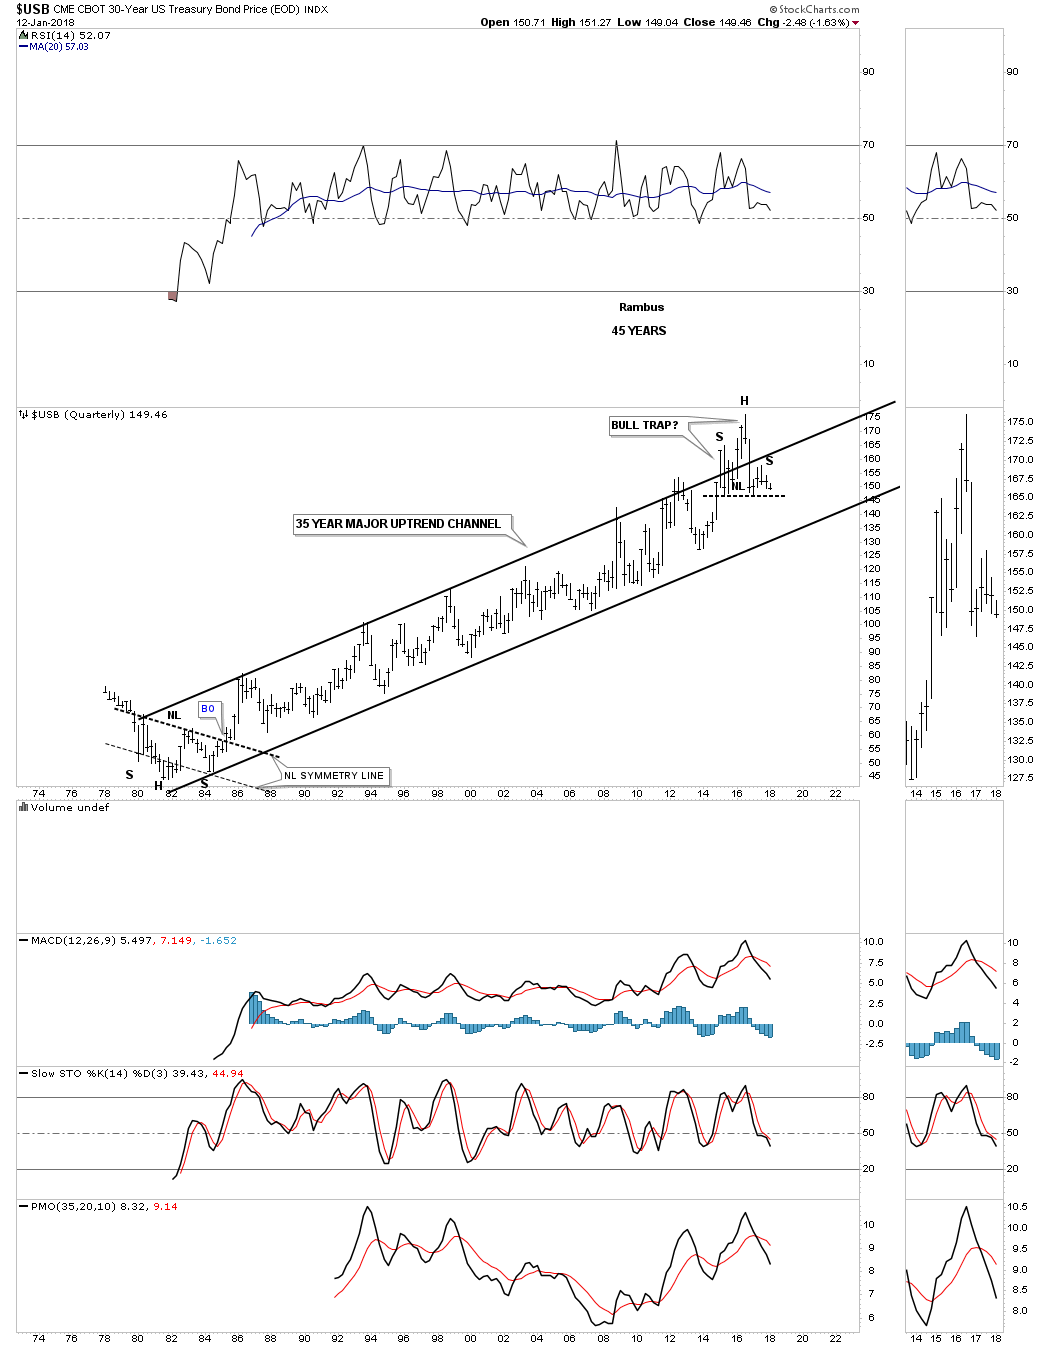
The reason I believe the 2 1/12 year H&S top will complete and signal the continuation of the bear market that actual began at the 2016 high, is because of what the very long term quarterly chart is showing us. After big moves either up or down one wants to look for a reversal pattern to reverse either the bear or bull market which takes time and energy to reverse such a strong trend.
This 45 year quarterly chart is showing us the $USB has built out a massive 35 year bull market uptrend channel with the 2 1/2 year H&S top forming at the very high. Actually the left shoulder and head formed above the top rail, but when the price action closed back inside the rising channel that breakout was negated. Normally when you see this type of price action it signals a capitulation or in this case a bull trap. Note the the very symmetrical five year H&S bottom which launched the $USB on its bull market back in the early 1980’s.
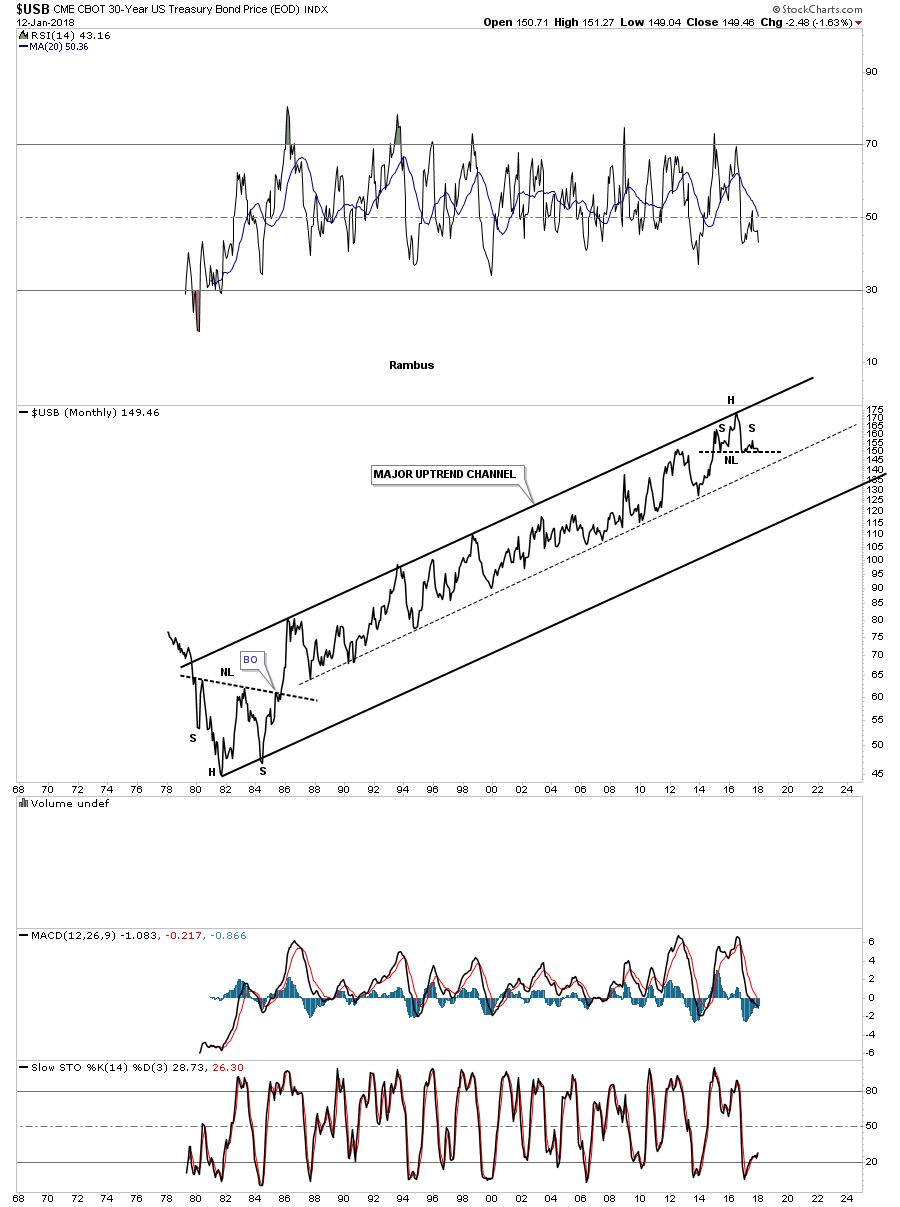
I always like to look at line charts as they can often times can give you a clearer picture vs a bar chart. A line chart can also show you a breakout sooner than a bar chart in many instances. Below is a monthly line chart for the $USB which shows a perfect parallel 35 year bull market uptrend channel with the H&S forming at the top. There was a multi year H&S that formed at the bottom of the chart which led to the 35 year bull market.
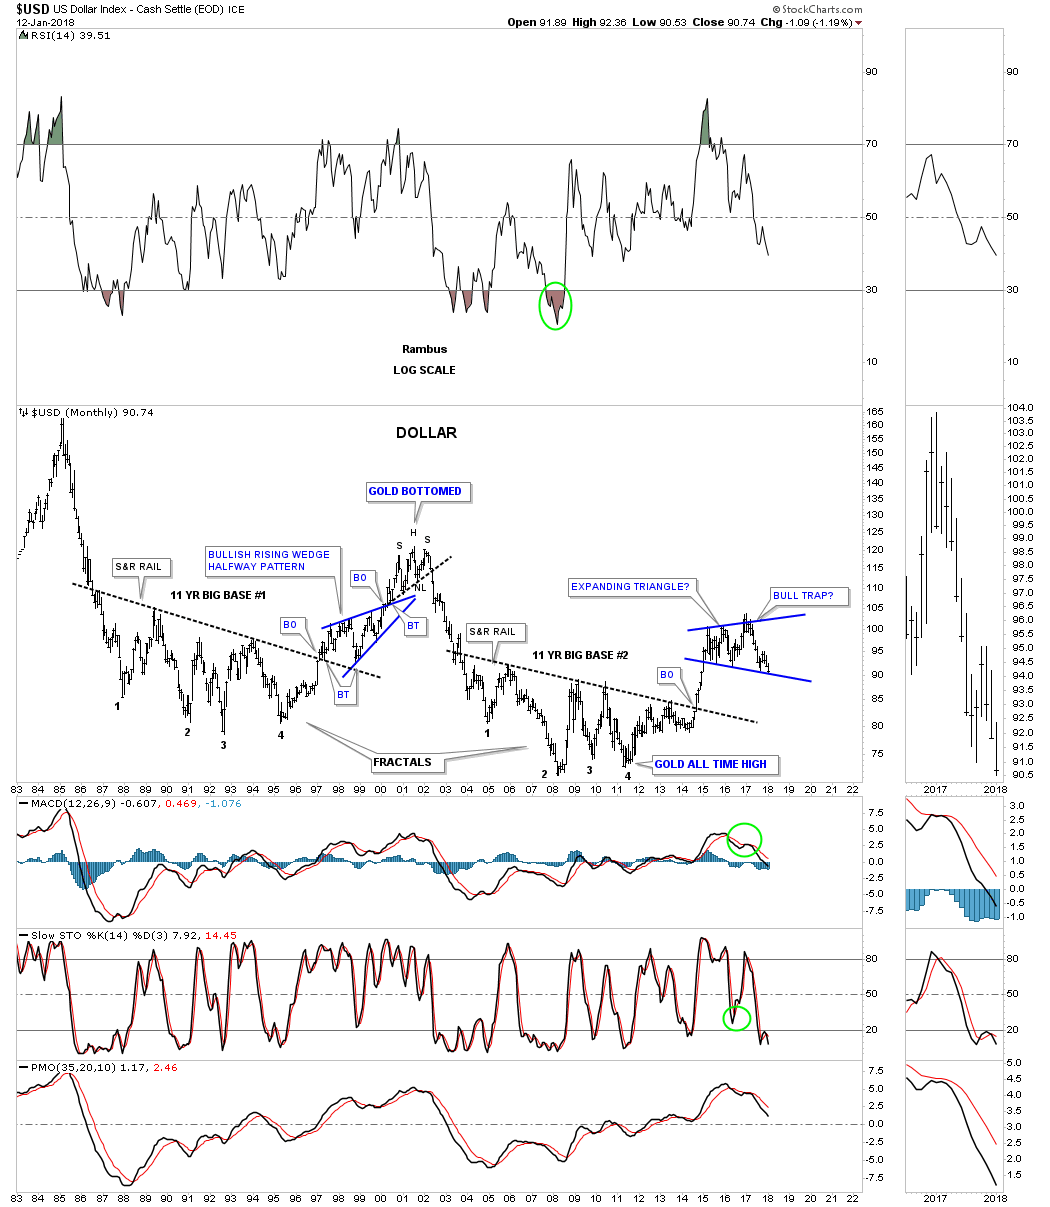
Next I would like to show you a long term 35 year monthly chart for the US dollar which shows two massive 11 year bases which I labeled as fractals because they so closely resembled each other. At this very moment I would call myself agnostic when it comes to the US dollar. The price action is sitting right on the bottom rail of a three year expanding triangle so an important inflection point is at hand.
Just over a year ago the US dollar experienced a false breakout above the top rail of its expanding triangle which I labeled as a bull trap that has led to the decline which is now testing the bottom rail. A strong break of the bottom rail would most likely be very bearish for the US dollar, which could decline all the way down to the big base #2 S&R line before any meaningful support would come into play. For the trades we are currently in a breakout below the bottom rail of the blue expanding triangle would be a welcomed sight.
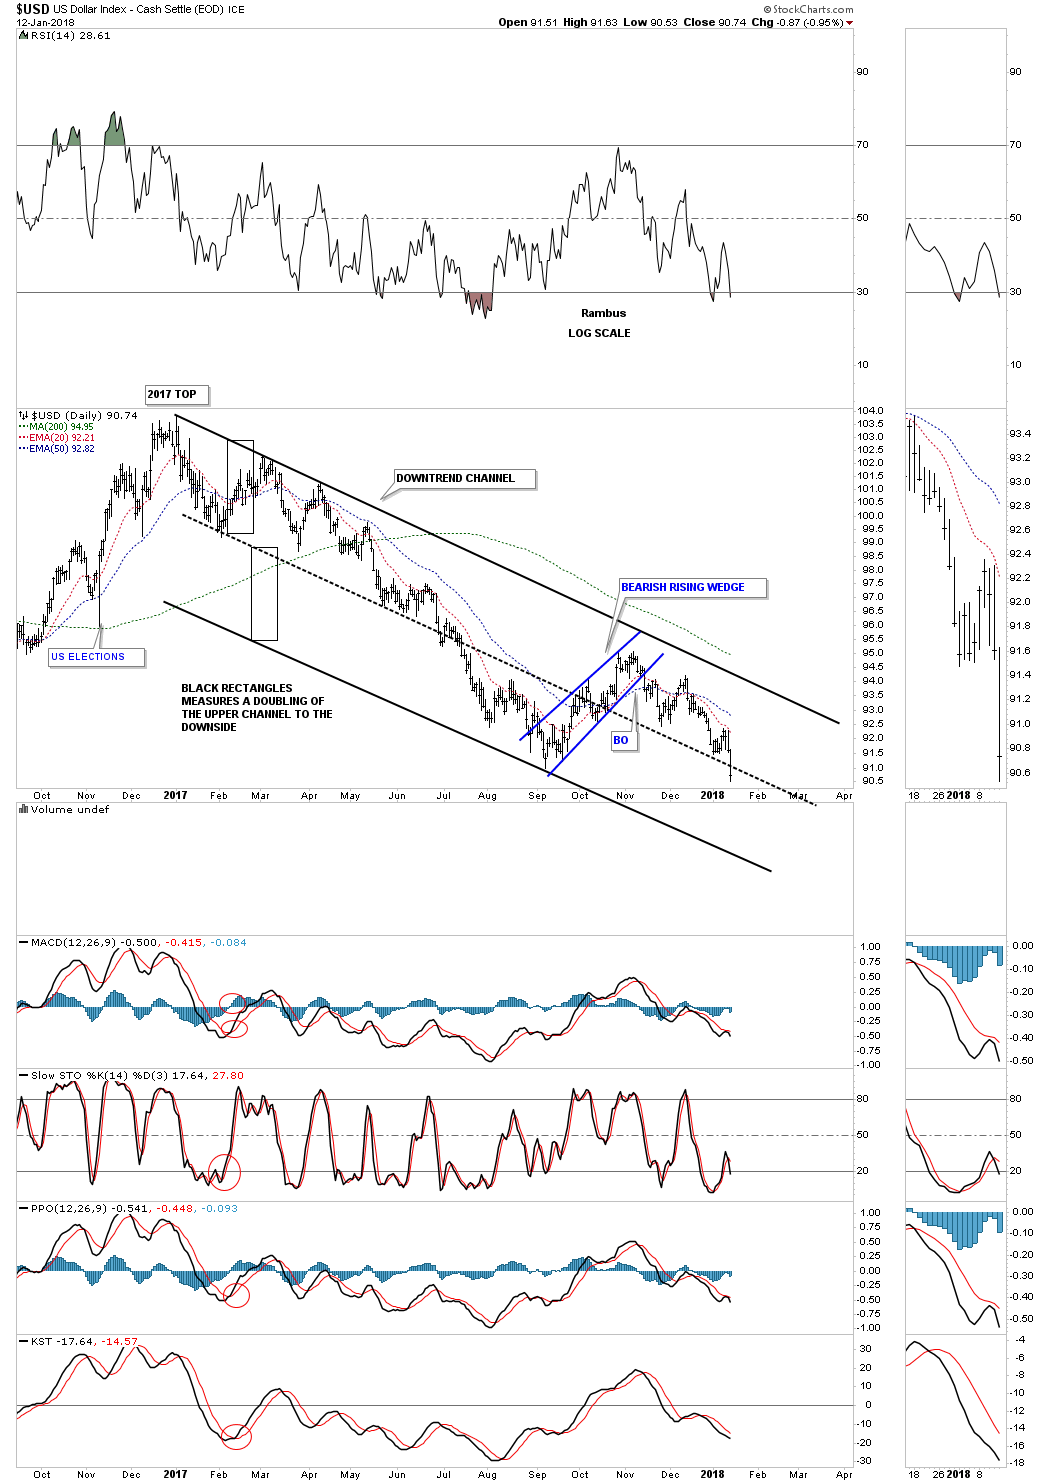
The daily chart for the US dollar shows its 2017 bear market downtrend channel still firmly intact. There is nothing bullish on this chart yet.
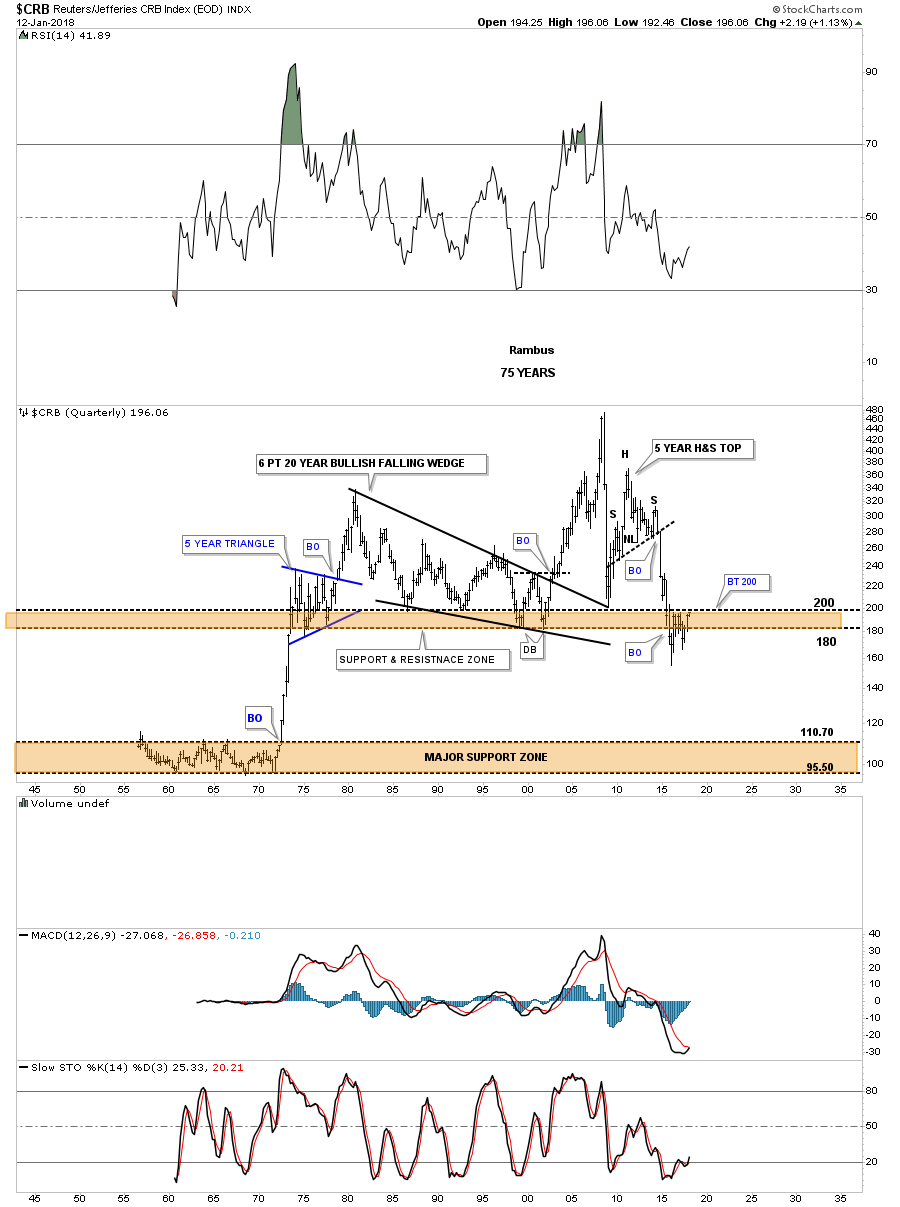
With a weaker US dollar over the last year the commodities complex has enjoyed a nice rebound from its bear market lows. The quarterly chart for the $CRB index shows several large patterns that have led to big moves. During the 1970’s bull market the price action built out a five year triangle consolation pattern, which led to the bull market high in 1980. From that bull market high the CRB index went into a long drawn out bear market, as shown by the 20 year six point bullish falling wedge.
After putting in a double bottom in 2000 the CRB index went on a a very strong impulse move up and made its all time high at 475 which still stands to this day. That was followed by the infamous crash into the 2009 low which led to a counter trend rally that failed to make new all time highs. It took close to five years to build out the H&S top which led to the next crash, in which just about every commodity and currency declined together in 2014 / 2015. At the time the decline was so sever that it looked like the CRB may fall all the way down to the 1970’s low after the brown shaded support and resistance zone began to fail. It now has been two years later and the CRB index is still trying to gain its footing as it’s trying to put in a bottom within the brown shaded support and resistance zone between 180 and 200. If this area ends up being an important low you can see there is a lot of room for a new commodities bull market to rally.
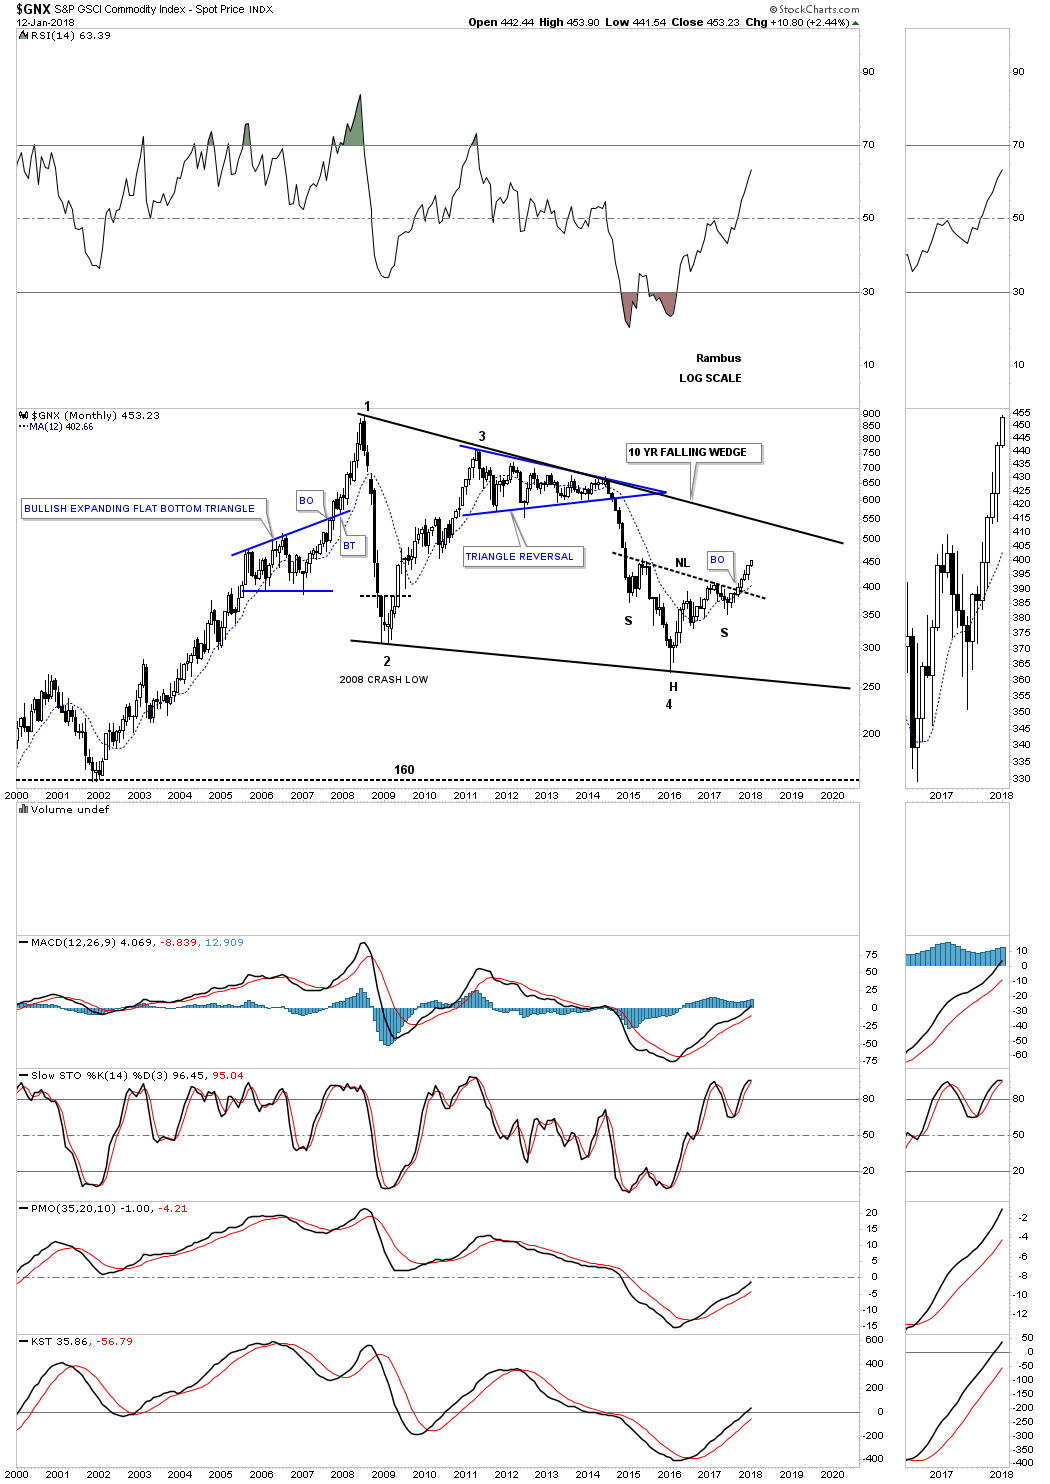
Below is another commodities index which is showing a very large 10 year falling wedge with a H&S bottom forming at the 4th reversal point. Note how vertical the move down was when the three year blue triangle gave way. That strong move down represents what most commodities and currencies looked like when they capitulated in 2014 and 2015 while the US dollar took on an inverse look.
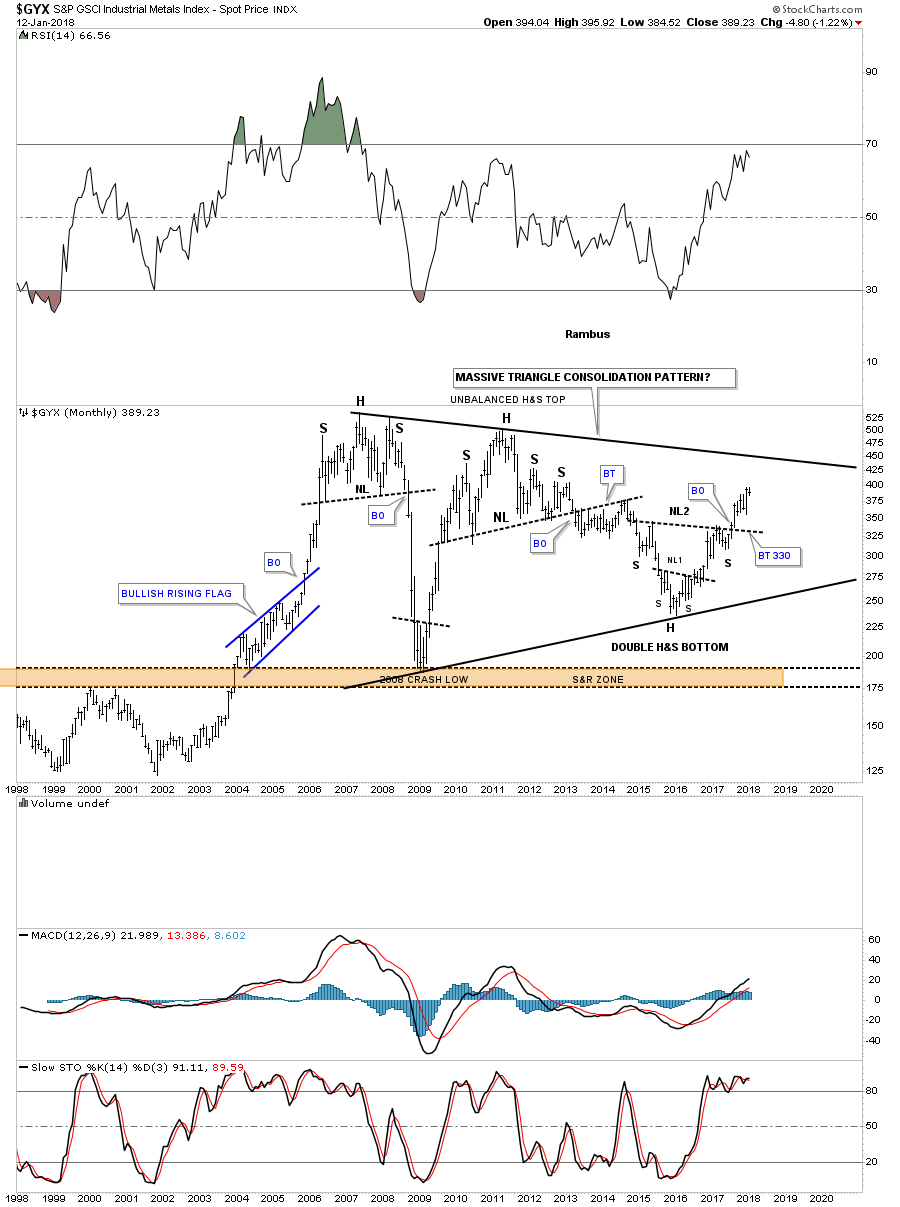
The $GYX, industrial metals index, is building out a very large triangle consolidation pattern with the 4th reversal point being a H&S bottom.
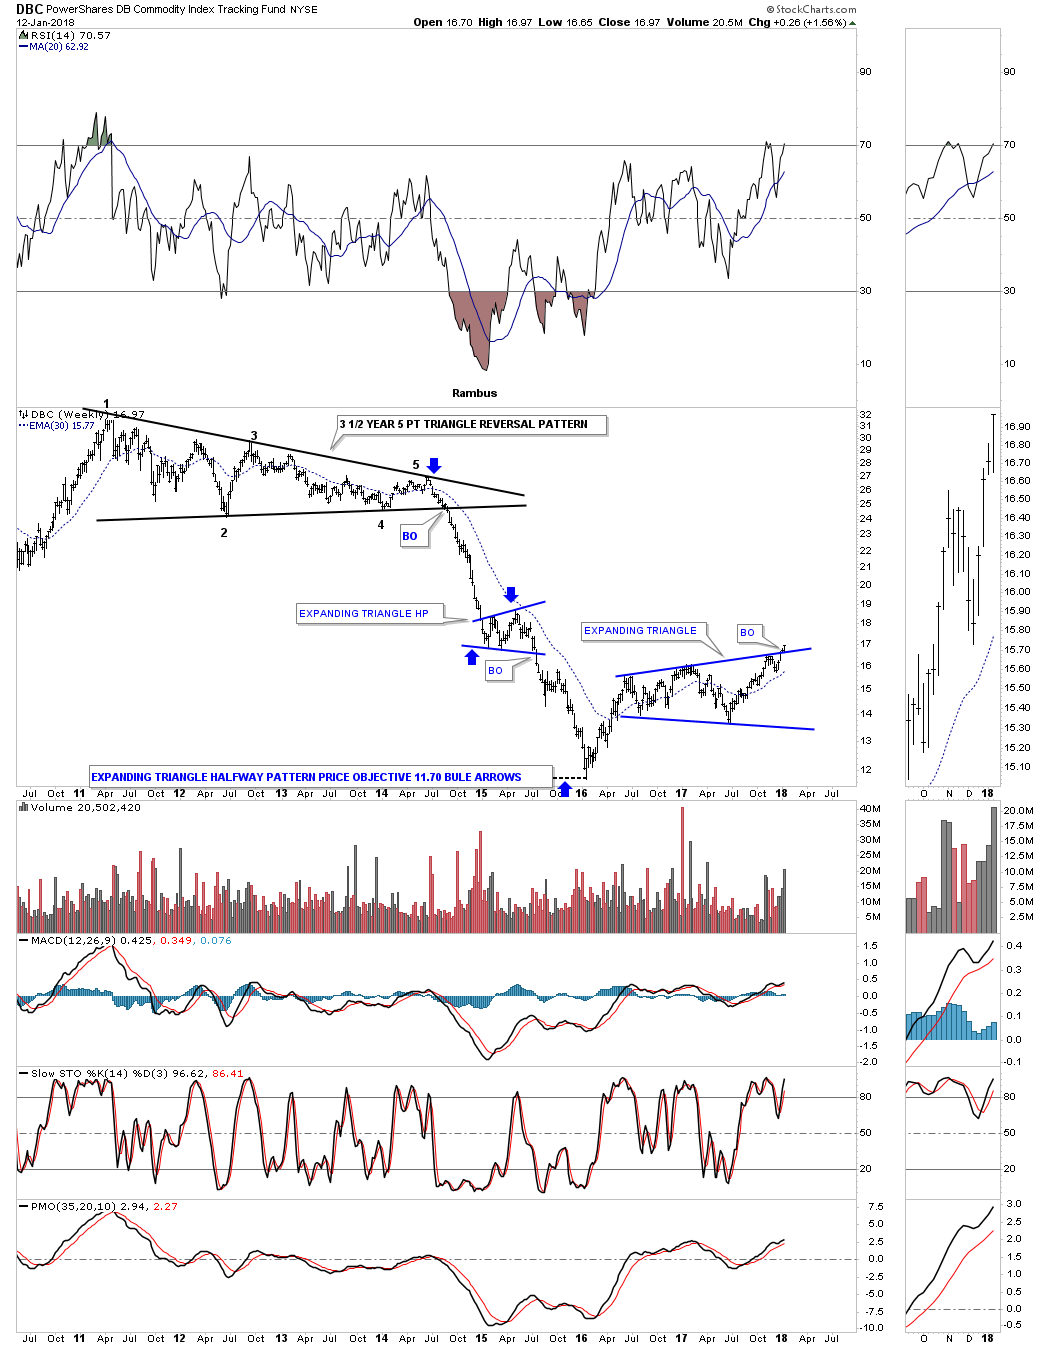
Below is a weekly look at the $DBC commodities index, which is the most actively traded of all the commodities indexes. Note the 3 1/2 year, 5 point triangle reversal pattern which led to its crash into the 2016 low. It formed an expanding triangle as a halfway pattern which nailed the low for the bear market. This past week the price action is attempting to breakout from another expanding triangle consolidation pattern.
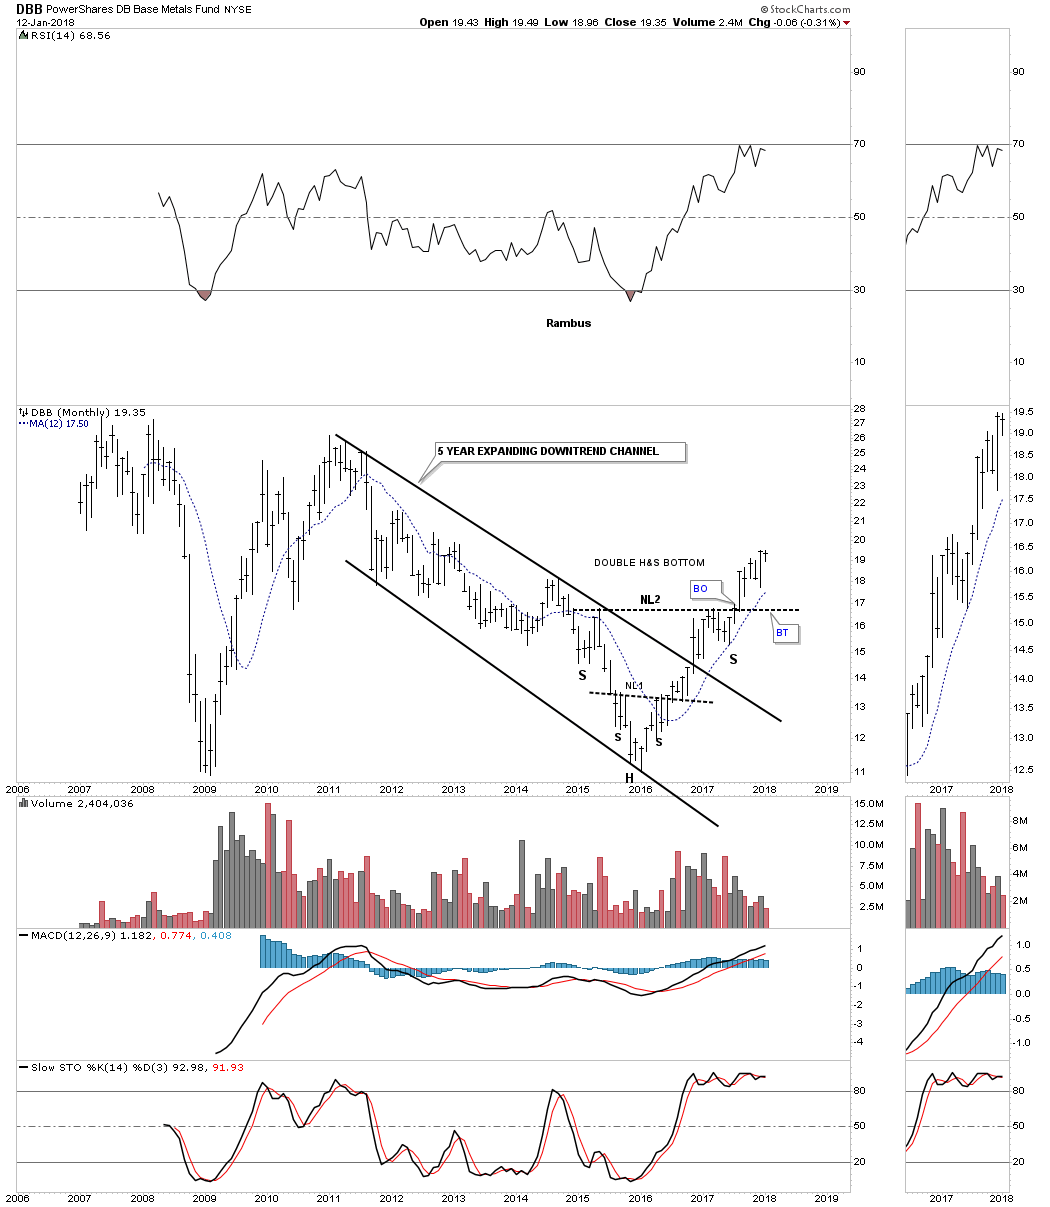
One of the first commodities indexes to really breakout was the DBB, base metals fund, putting in a double H&S bottom. This chart also shows you the five year bear market that just about everything commodity and currency related looked like. When looking at long term charts there are usually key reversal dates that most stocks or indexes will reverse around. Here you can see the 2009 crash low, the 2011 top, and the 2016 low are important turning points which you will find on a lot of commodity charts.
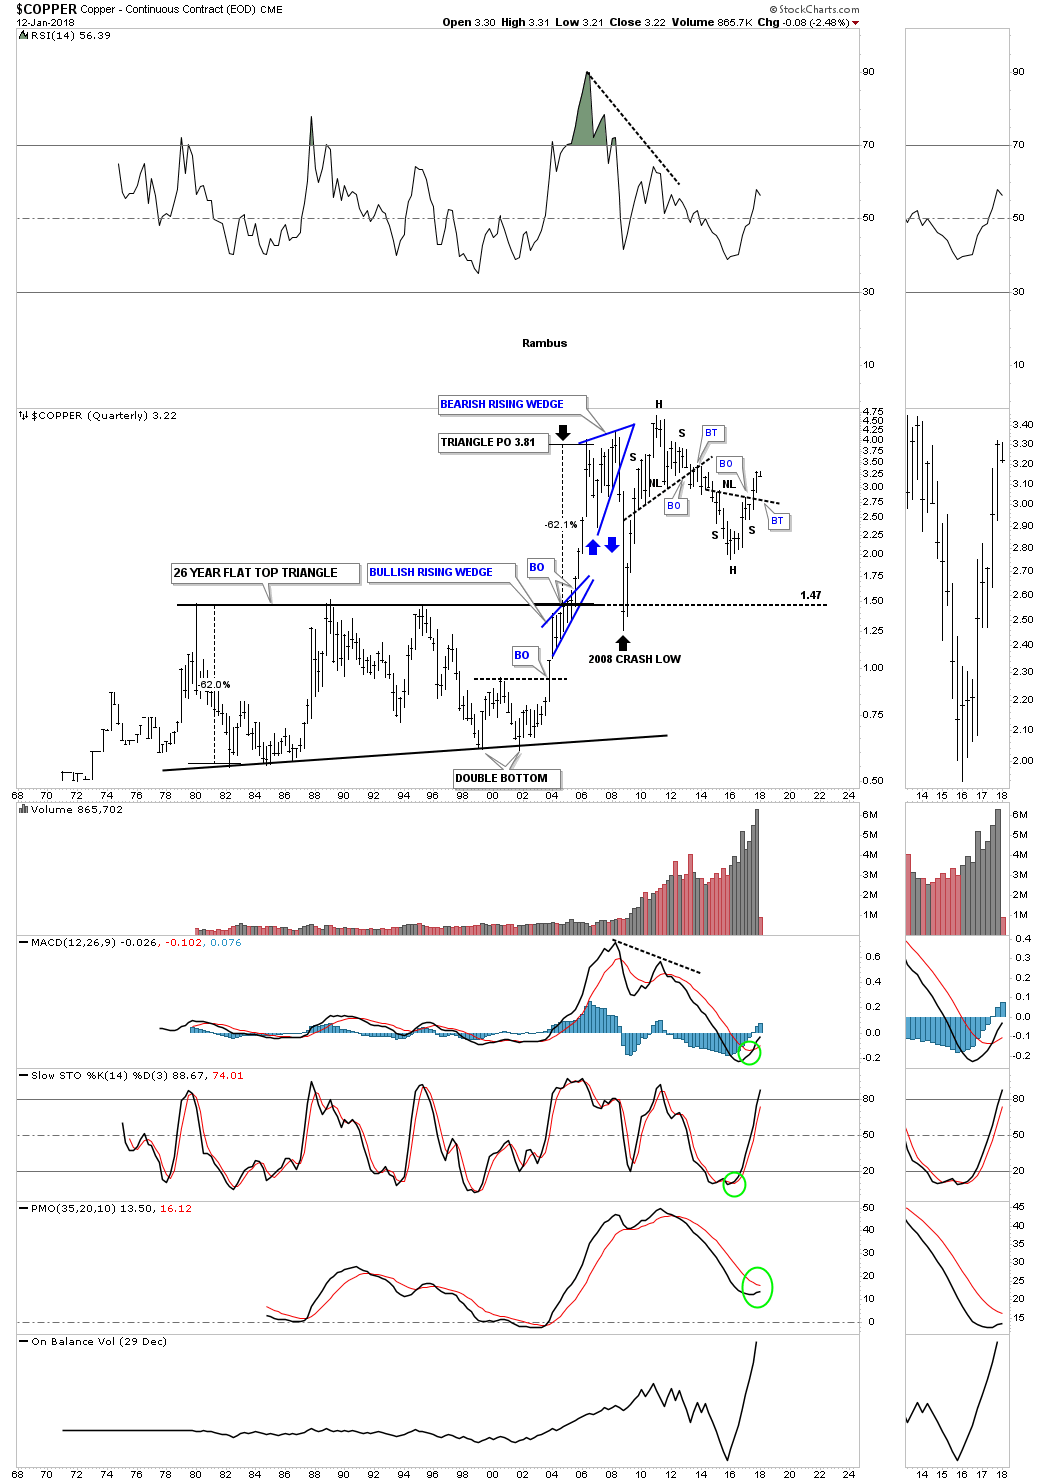
Lets now look at several of the more important commodities of the world starting with Copper. Almost half of this 50 year chart shows a massive flat top triangle which finally broke out in 2004 which led to a tripling in price. Note how the top rail of that massive flat top triangle reversed its role to support during the 2008 crash low to what had been resistance previously. Copper is currently in the third quarter of its breakout move out of its H&S bottom. This chart is another example of how big chart patterns lead to big moves.
Below is a 20 year monthly chart for $NATGAS, which shows it built out a seven year H&S top reversal pattern to end its bull market in 2005. Natural gas tends to produce some big moves once it has finished building out a reversal or consolidation pattern. It’s currently attempting to breakout of the blue one year falling wedge formation which I would view as a halfway pattern to the upside.

The $WTIC oil index, is another commodity that built out a very large reversal pattern which was the 19 year massive double bottom. That massive double bottom led to a 277% move up to oil’s all time high at 147. Note how the 2008 crash low found support at the brown shaded support and resistance zone. It took oil five years to build out the unbalanced H&S top which along with most commodities and currencies crashed into the 2016 low.
During the formation of the head, the big spike below the support and resistance zone, it looked like it wasn’t going to hold, but when the quarter was finally finished the price action closed back into the brown shaded S&R zone leaving a long tail behind. Oil is currently in the second quarter of it breakout move out of its H&S bottom. One last note before we move on. Notice the big blue bullish rising wedge which formed just below the brown shaded S&R zone, which finally gave oil the energy it needed to finally breakout, which led to its all time high at 147.
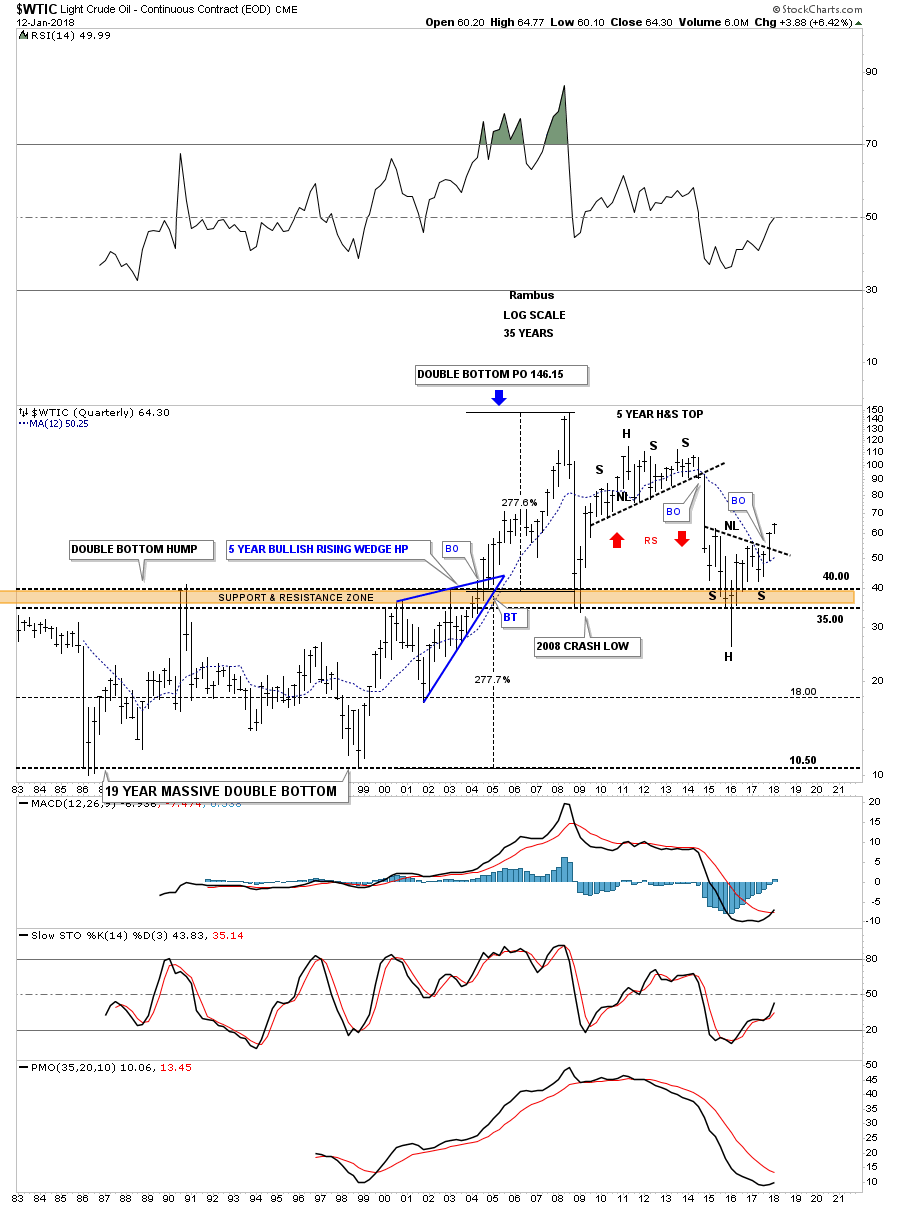
The 20 year monthly chart for oil shows that it’s a good producer of big chart patterns and H&S tops, bottoms and consolidation patterns. Once oil broke out from that five year bullish rising wedge that was your cue to go long and hang on for dear life as you knew a big move was going to take place. Keep in mind when you look at our current H&S bottom that the minimum price objective will be the distance from the head to the neckline added to the breakout point on the neckline.

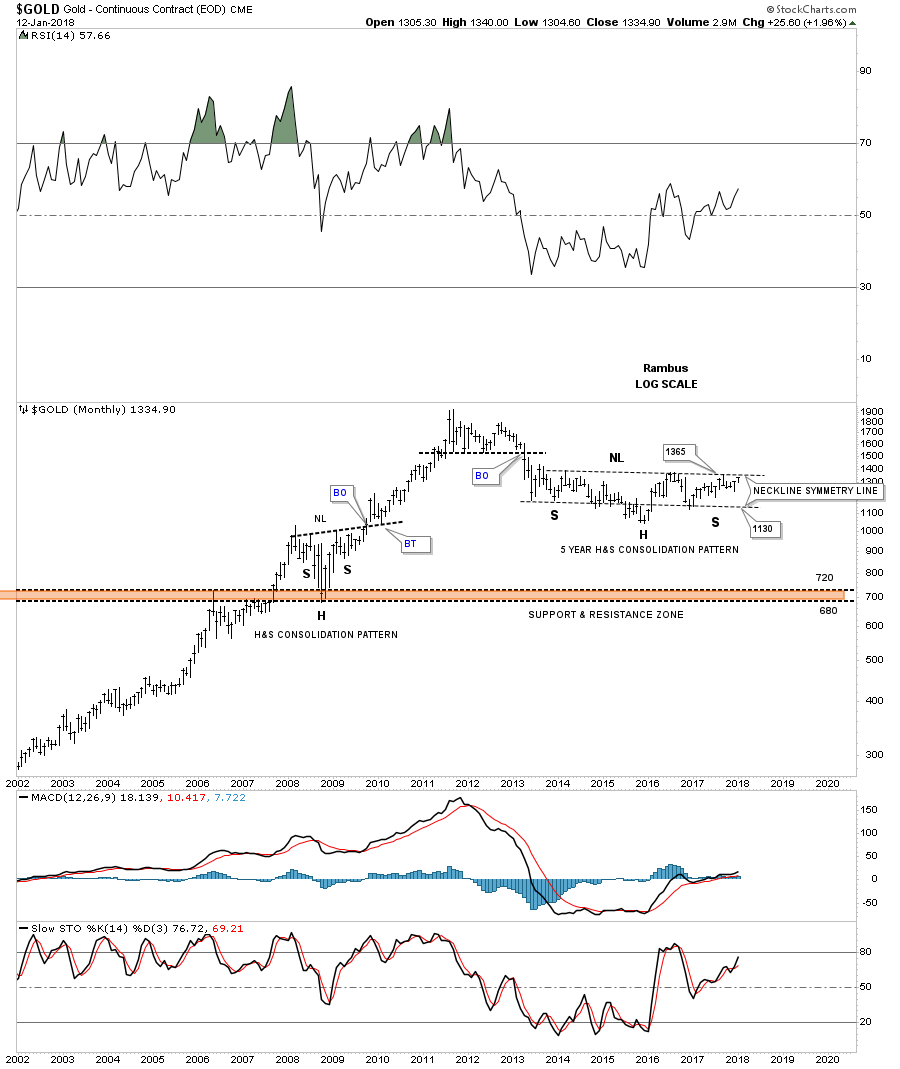
Next lets take a look at gold as it has produced some big chart patterns through the years. This first chart is a 20 year monthly look which shows golds 20 year parallel bull market uptrend channel and the six year black expanding falling wedge We’ve been following this chart for many years waiting for confirmation the bear market is over. It’s been a long drawn out breaking out and backtesting process where the bottom rail of the bull market uptrend channel and the top rail of the 6 year bullish expanding falling wedge intersect.
Every time the price action would touch the bottom rail of the uptrend channel I would put a blue arrow on the chart. The last blue arrow came right at the intersection of the two main trendlines and the price action is starting to rise once again. Is all the work finally over now? Note the black bullish expanding falling wedge that built out during the 2008 crash that had three months of backtesting before the impulse leg up began.
From purely a Chartology perspective follow the price action at the lower blue arrow labeled #1 that formed in December of 2015 low. Note how the price action broke out above the top rail of the blue falling wedge which was backtested twice during the next ten months. Blue arrow #2 shows the last backtest to the top rail of the blue falling wedge and the bottom rail of the bull market uptrend channel. From that point gold then rallied back up to the top rail of the black expanding falling wedge where it found resistance once again. This time the price action declined once more down to the bottom rail of the bull market uptrend channel, blue arrow #3.
After ping ponging between the two trendlines gold finally broke out above the top rail of the black expanding falling wedge and then just recently backtested the intersection of both trendlines at the blue arrow labeled #4. This is perfect Chartology. What we want to see now is for gold to make a higher high. Note the multi year double bottom base at the bottom of the bull market uptrend channel that was needed to launch such a massive bull market into the 2011 high. If the black six year bullish expanding falling wedge continues to play out it will be a big enough consolidation pattern to launch a multi year rally in which the rest of the PM complex will have to follow.

This next chart for gold shows the other reversal pattern that everyone is looking at which is the possible five year H&S consolidation pattern. Somewhere around the 1365 area the neckline will come into play that’s when we will need to watch the price action very carefully. A breakout above the neckline will give us another level of confirmation that the bull market is back.
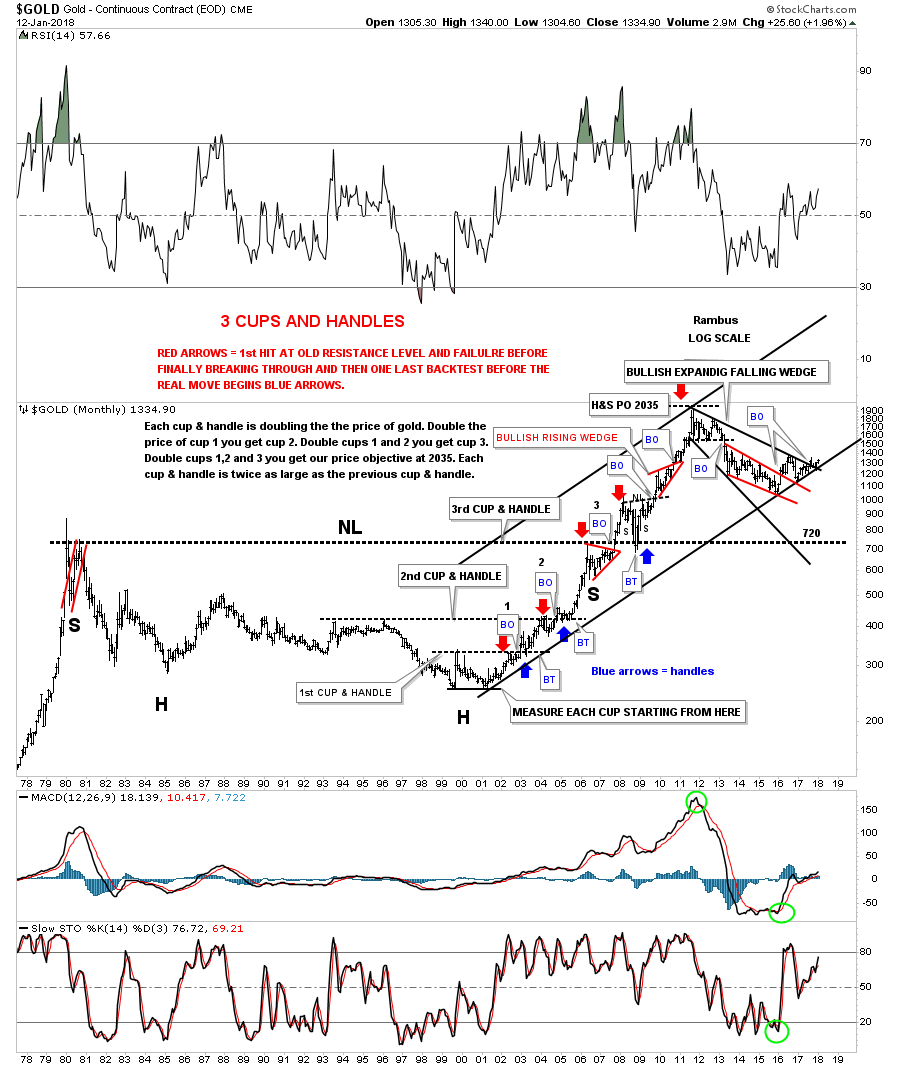
This last chart for gold has one of the biggest reversal patterns I’ve ever seen and one of the prettiest uptrends I’ve ever had the pleasure of charting. After the bull market top in 1980 gold fell into a bear market that lasted 27 years until the neckline was broken in 2007. For those that remember the 2008 crash gold found support on a backtest from above to that 27 year neckline, which gave me a big clue the correction was over. That massive H&S base had a price objective up to the 2035 area which was slightly higher than the 1920 actual high, but for big patterns like this it was pretty close.
The other beautiful Chartology on this chart is the 3 cups and handle patterns that formed gold’s bull market uptrend. There were three cups that double the price of gold to the next cup. The red arrows shows the initial hit of the resistance line followed by a small reaction. Then gold would rally through the resistance line and backtest it from the topside, blue arrows. The third cup was actually that massive H&S bottom.
Buying the absolute bottom isn’t always a good thing unless you have a lot of time for the trade to take hold. Gold actually bottomed two years ago, but has been doing a lot of the necessary work to launch the next leg up. While gold has been slowly working its way higher the real action has been in the stock markets which most gold investors want no part of, which is a shame. Your trading account doesn’t care where the money comes in from, only that it grows so you can enjoy the fruits of your labor.
I still have plenty of more big chart patterns to show you so I guess I will do a part 4 in the near future. Have a great Weekend. All the best…Rambus
Precious Metals (And More on Stocks)
Prepared on January 16, 2017In this final post on Big Chart Patterns Part 4, we’ll look at some individual stocks that have benifted from some very large chart patterns. I realize that many are skeptical that these big chart patterns are of no use as there is no way to trade them, which would be incorrect. Big chart patterns lead to big moves and the big moves are made up of smaller consolidation patterns that one can trade if they so desire, which in some case would be the thing to do.
I’ve stated many times that I’m an intermediate term trader and that means I want to catch as much of an impulse move as possible before the next consolidation pattern begins to develop. Sometimes you win and sometimes you lose if get out to early or to late, or the consolidation area you were looking for doesn’t materialize and you have to start looking for a new entry strategy. It all looks easy in hindsight, but when you’re trading in real time things are totally different as ones emotions can take over and ruin a good trade before it has time to develop. With that being said lets look at some individual stocks to see how some of the really big chart patterns gave you an edge in understanding what was truly happening.
I’m not going into a lot of detail describing these charts as they are pretty self explanatory. As you view many of these big chart patterns as halfway patterns, note the rally phase leading into the big chart pattern, and where applicable the rally leaving the big chart patterns.
This first chart is AMAT which built out a 13 year bullish falling wedge consolidation pattern. Note the bull market in the 1990’s and the consolidation patterns that kept that bull market intact until the 2000 high. AMAT is currently trading in new all time high territory.
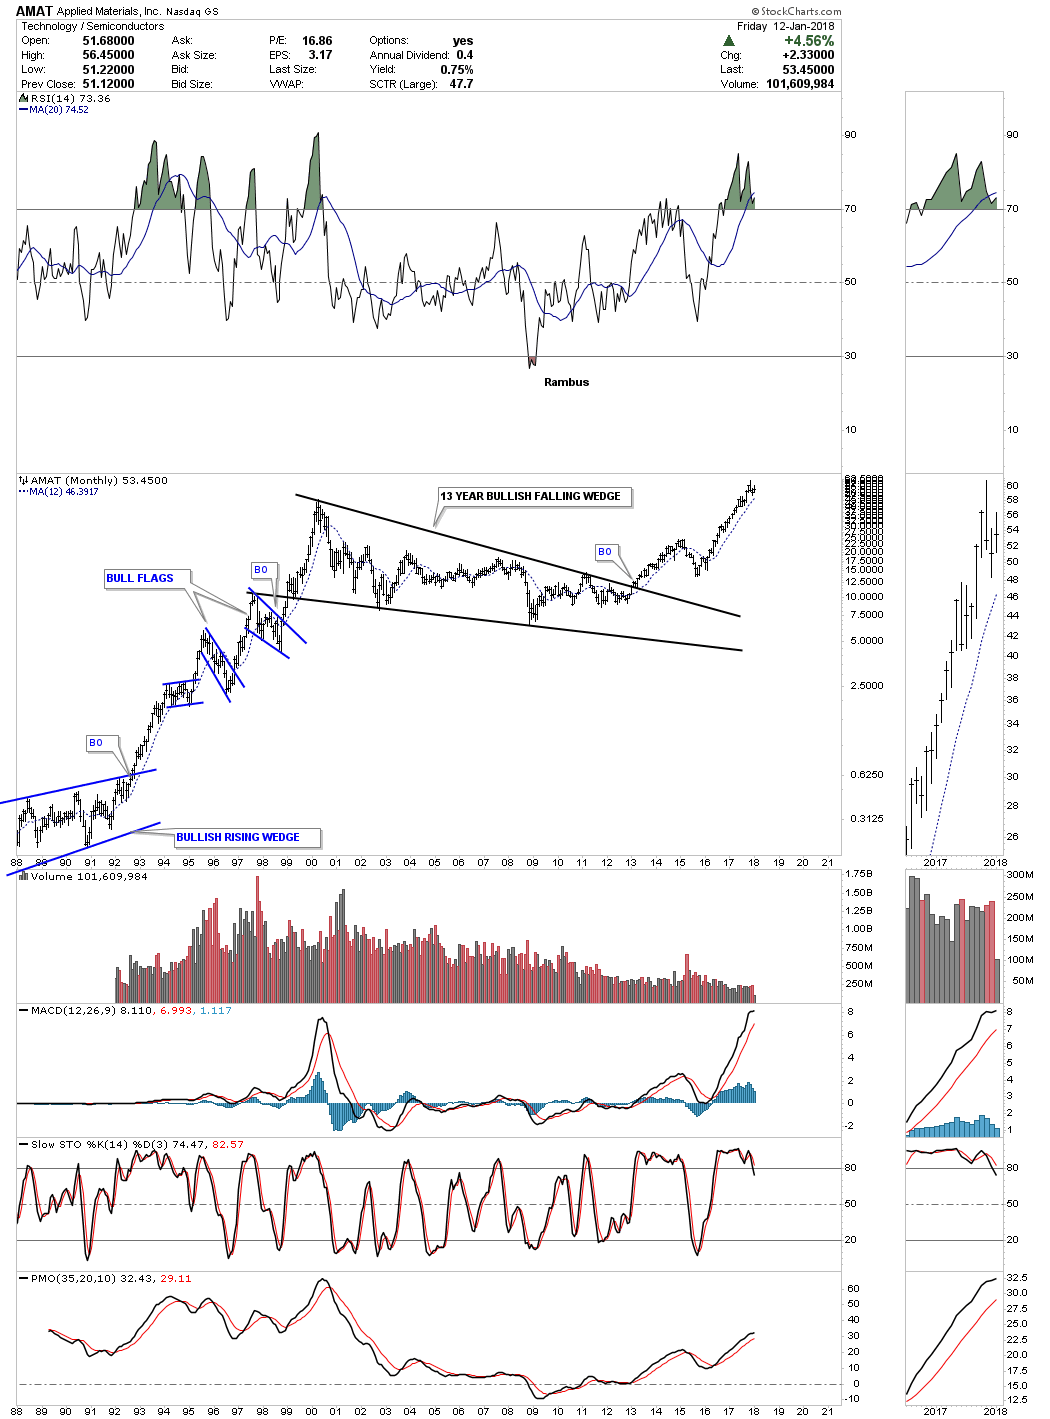
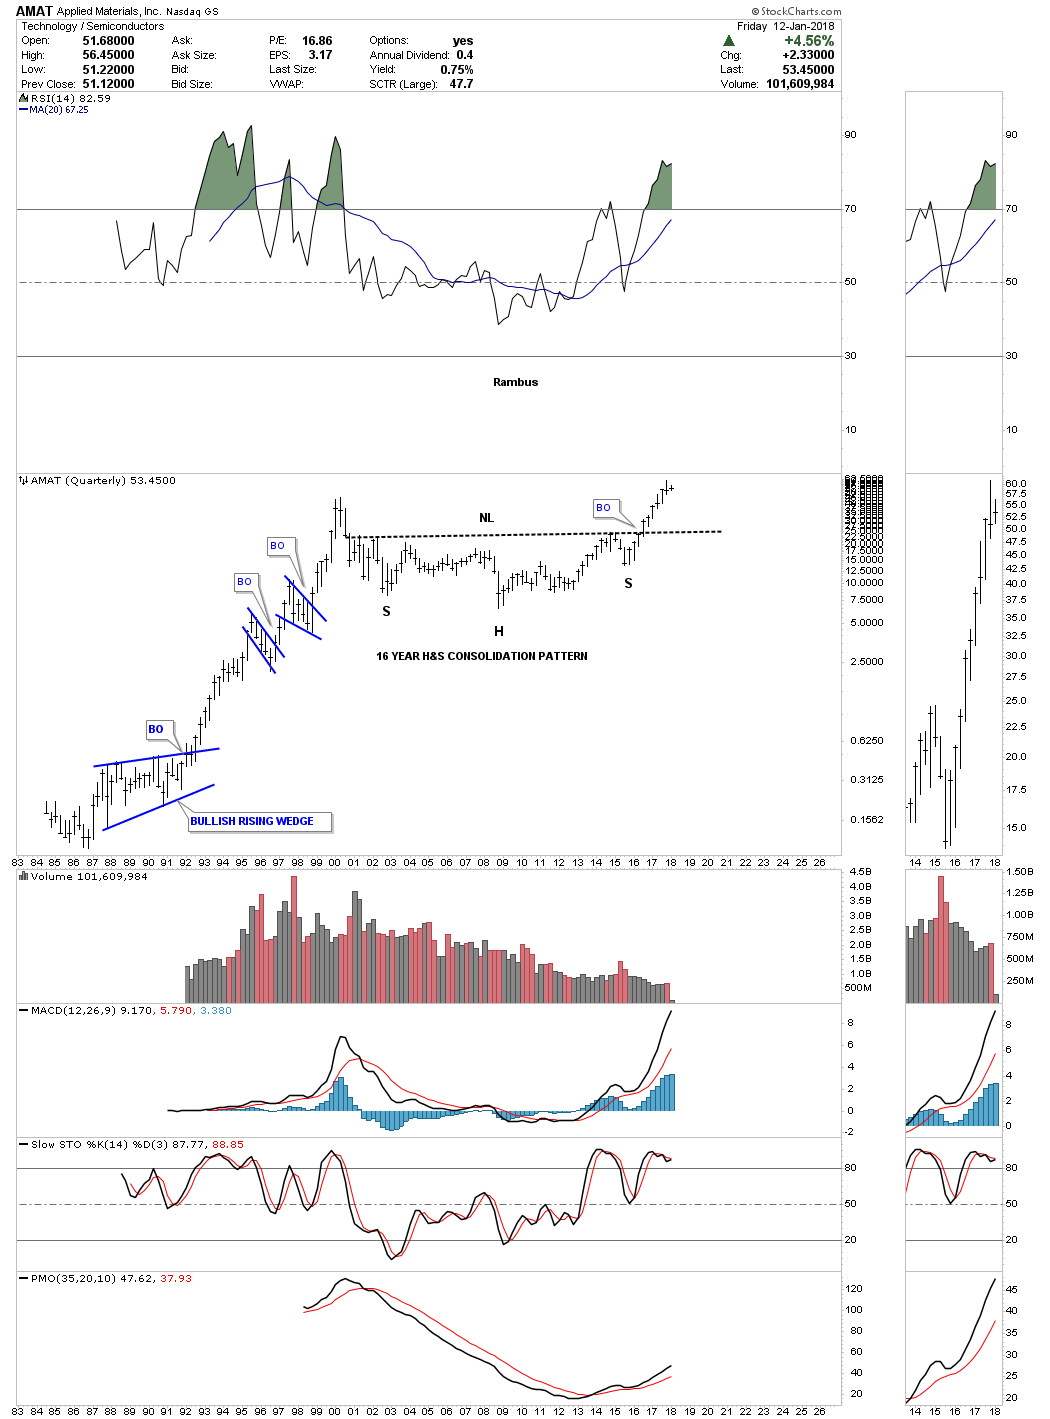
The 35 year quarterly chart shows the entire history and another massive consolidation pattern during the correction phase which is a 16 year H&S consolidation pattern.
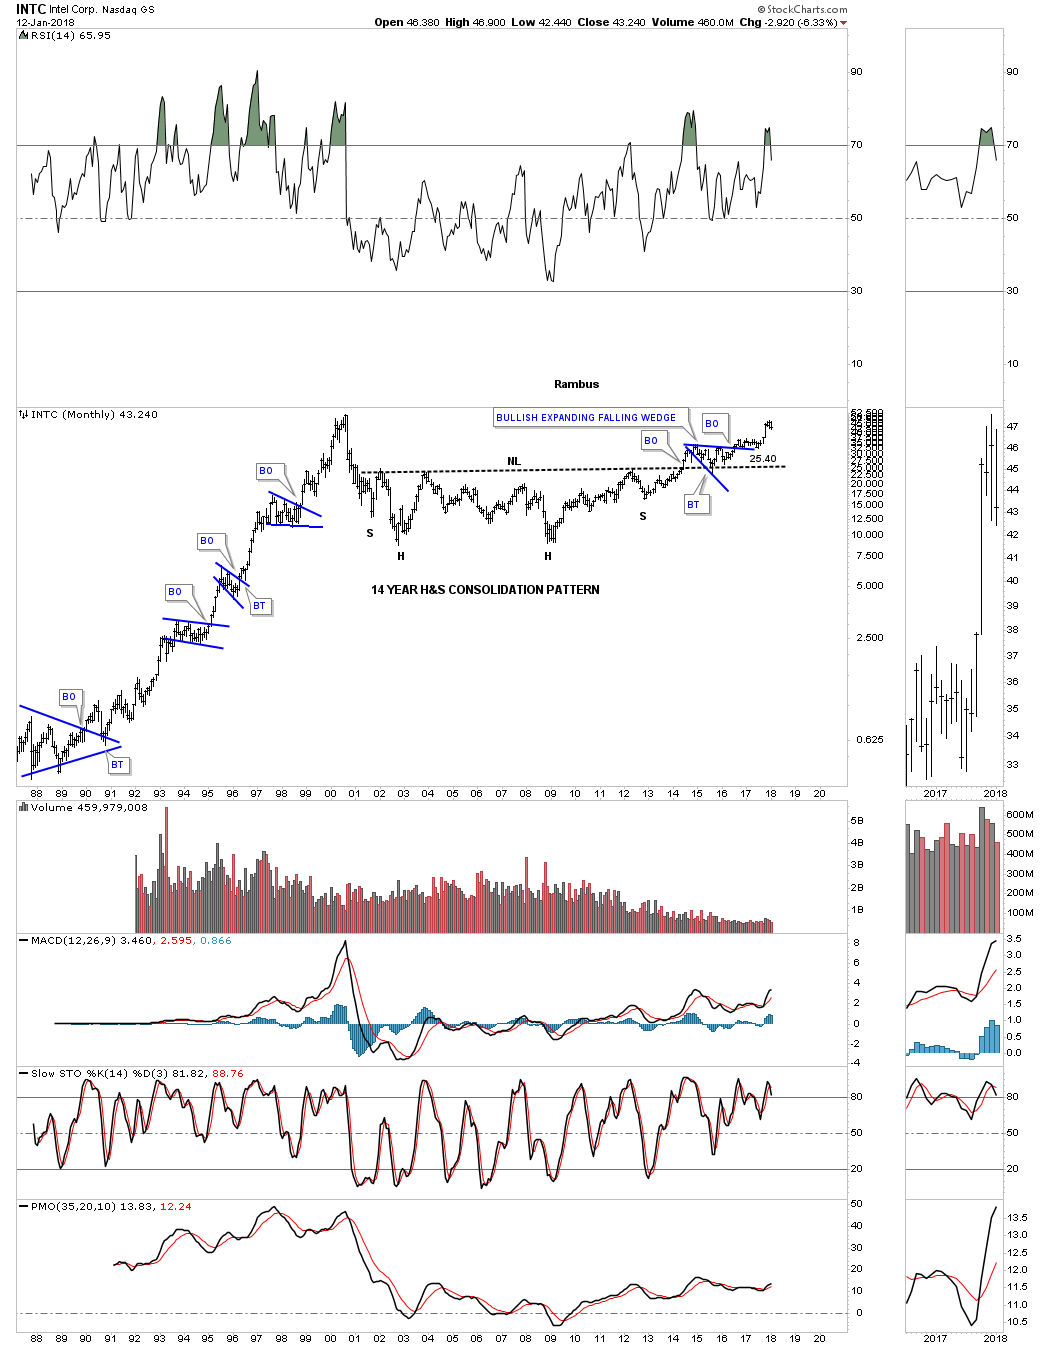
INTC built out a massive 14 year H&S consolidation pattern with the blue bullish expanding falling wedge as the backtest.
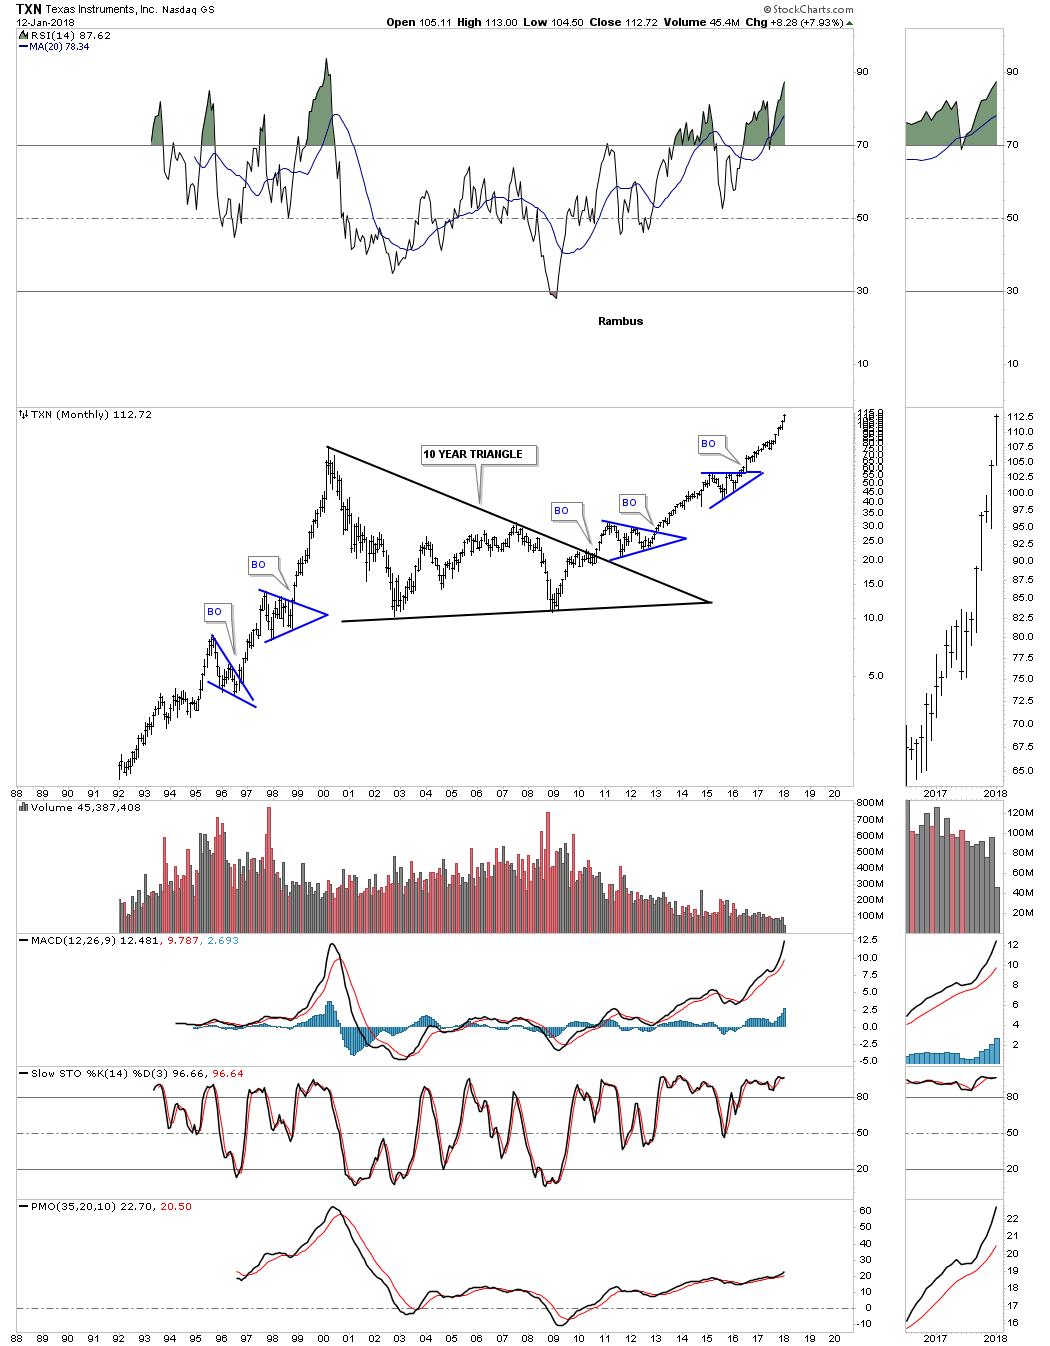
Below is a 30 year monthly chart for TXN which shows you a very good example of how these big consolidation patterns look as a halfway pattern.
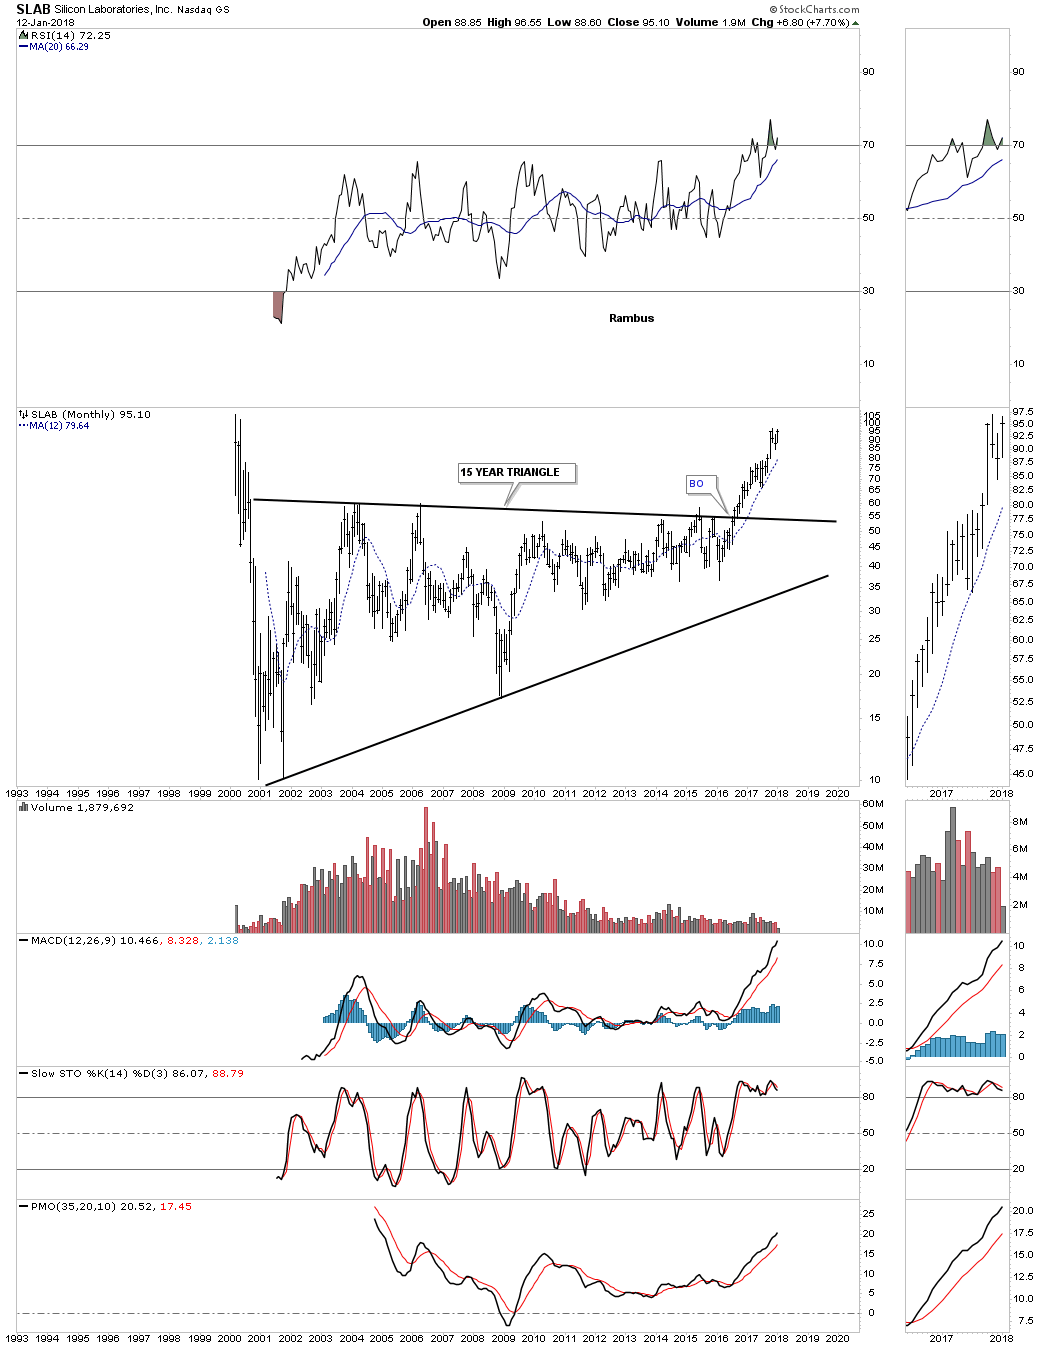
Next is a 25 year look at SLAB and its 15 year triangle consolidation pattern.
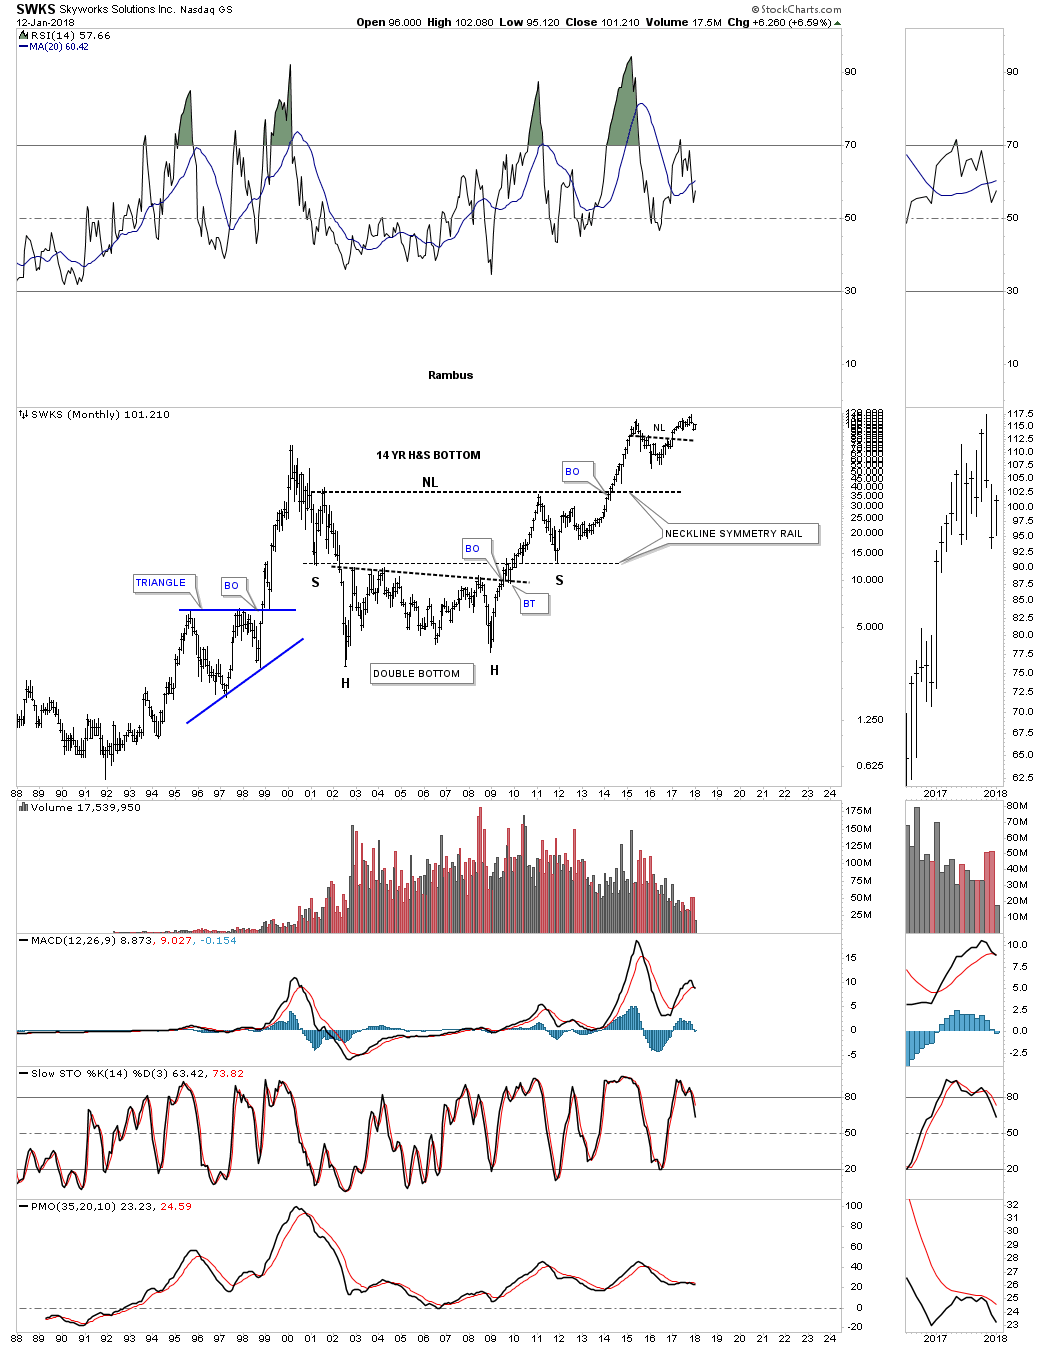
SWKS built out a massive 14 year very symmetrical H&S bottom as its consolidation pattern.
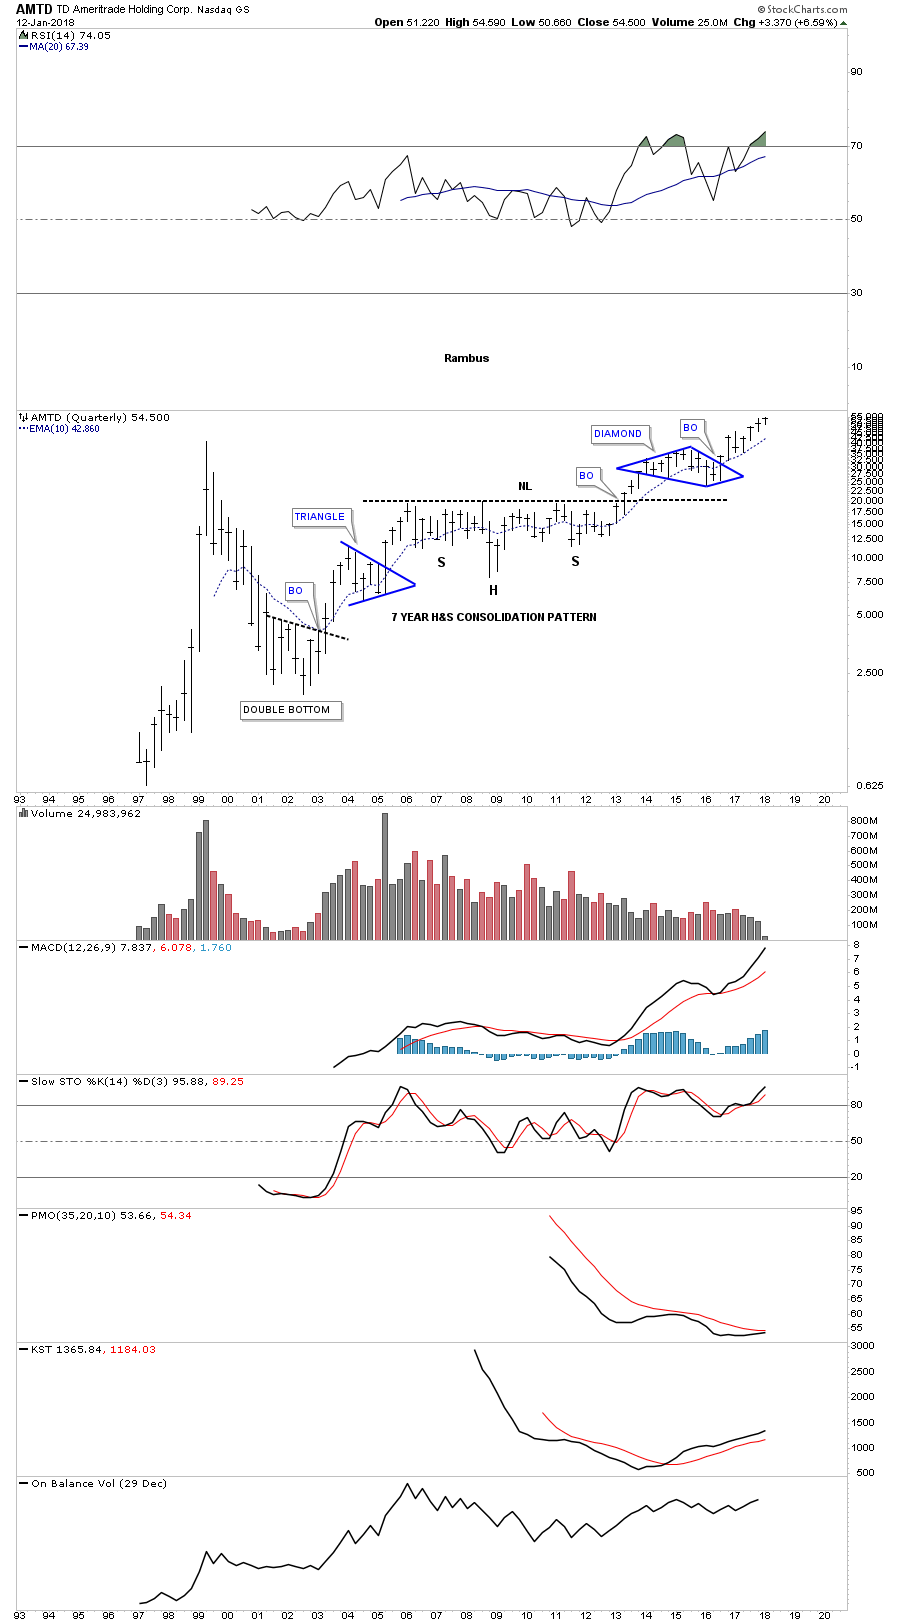
Below is monthly chart for AMTD which shows you a couple of big consolidation patterns, the seven year H&S consolidation pattern and the three year eight point diamond consolation pattern. The price action is currently in breakout mode out of the small blue triangle just above the diamond.
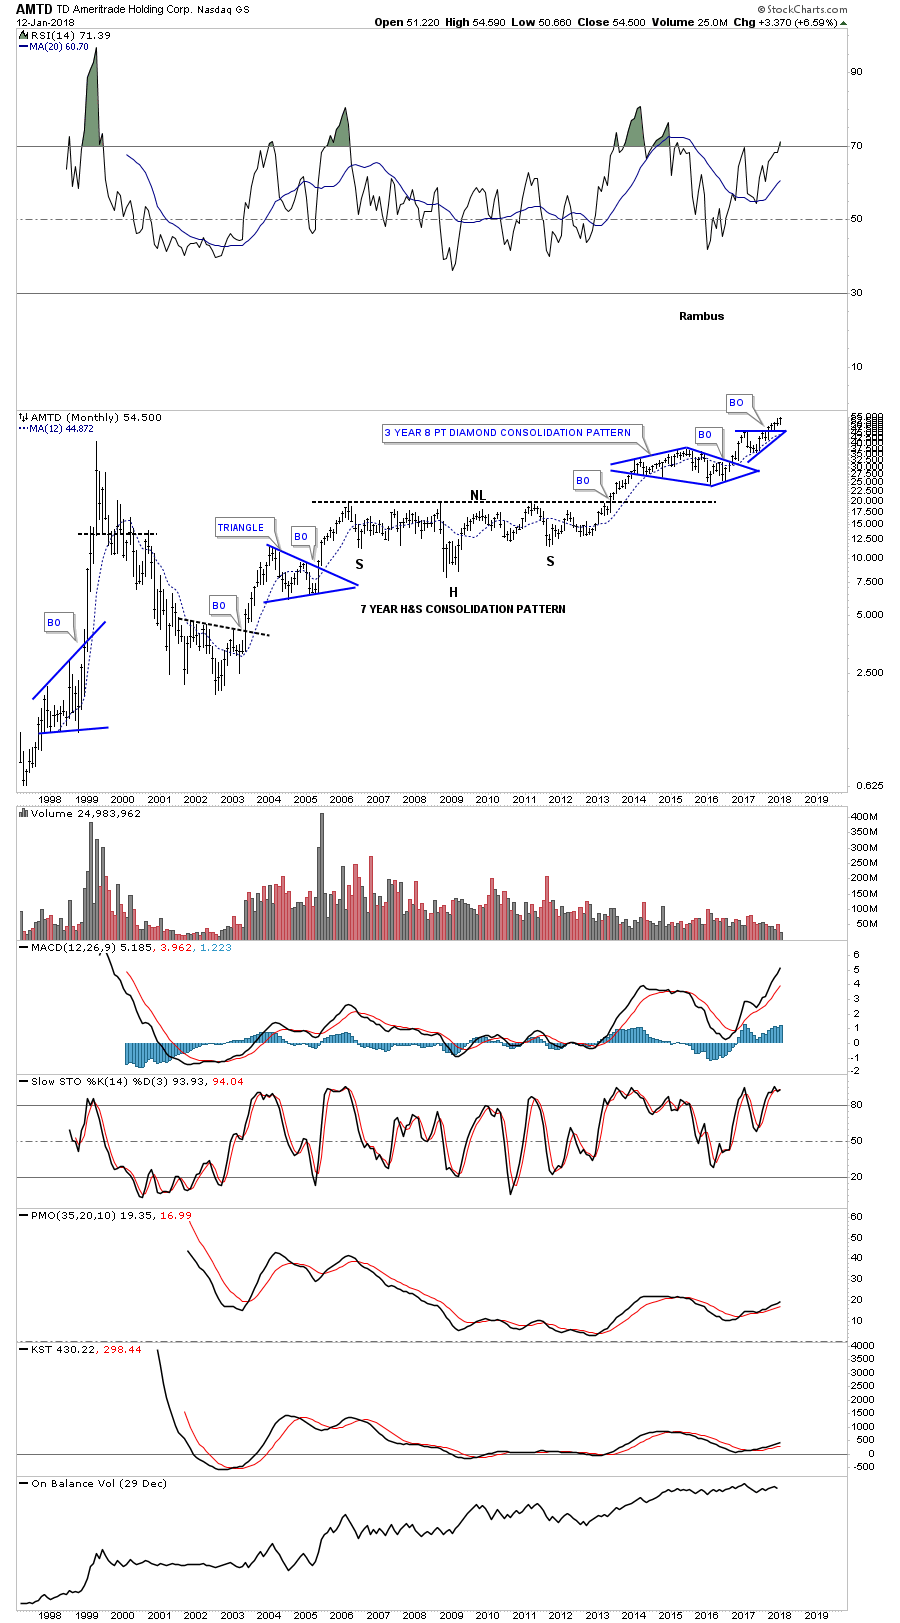
This chart shows the entire history of AMTD.
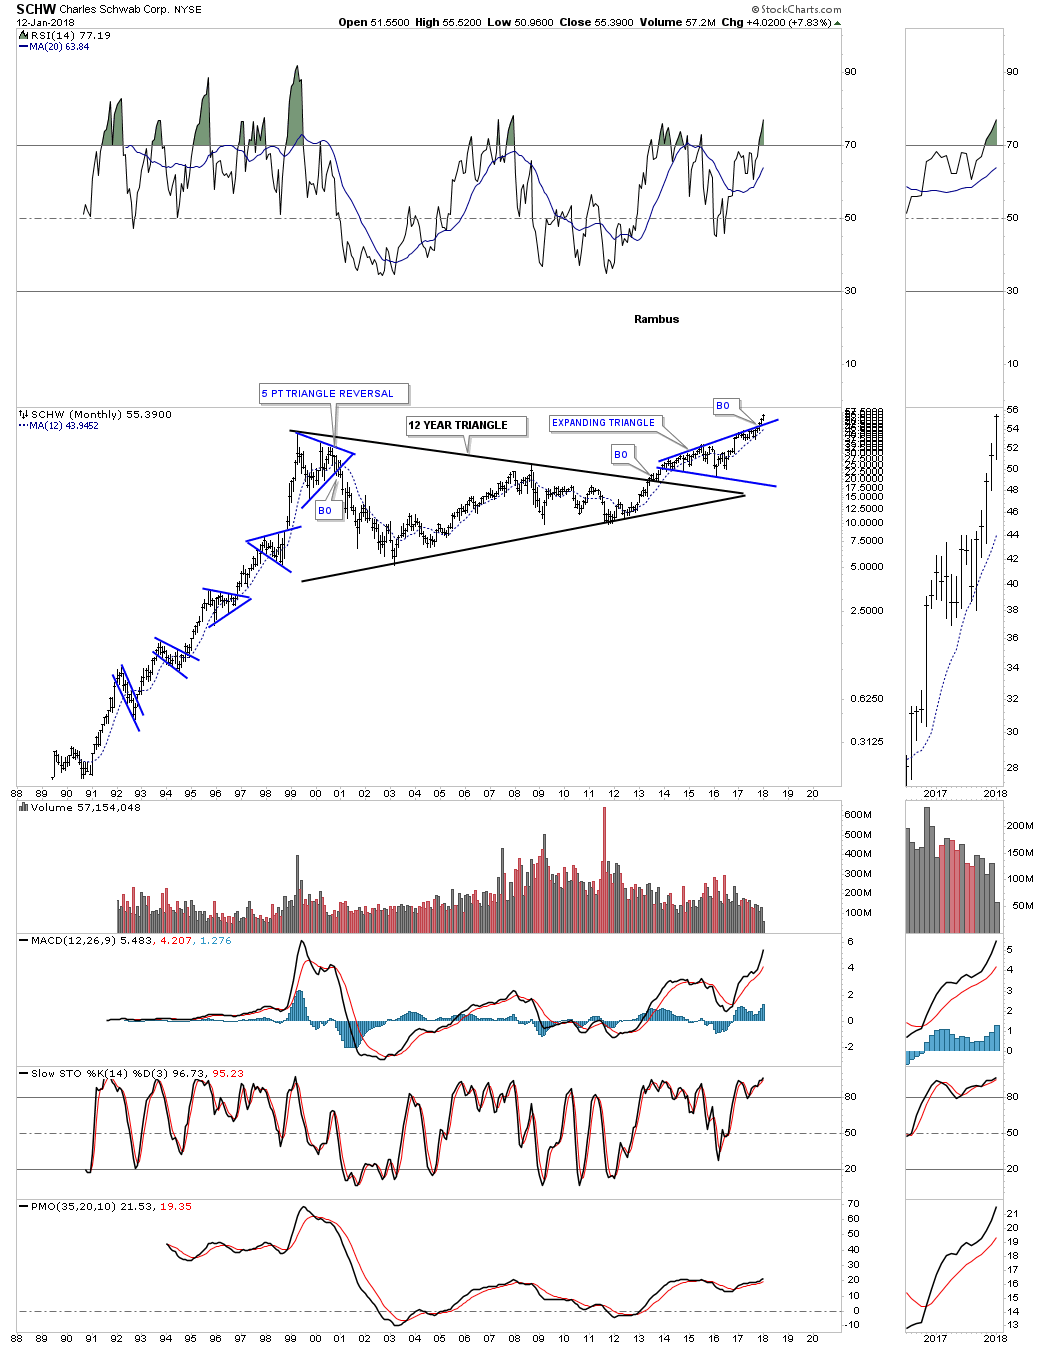
SCHW is another discount broker which was one of the first in that sector and has the most history. It took 12 years to consolidate the 1990’s bull market which formed the 12 year triangle. It’s currently breaking out from a four year expanding triangle.
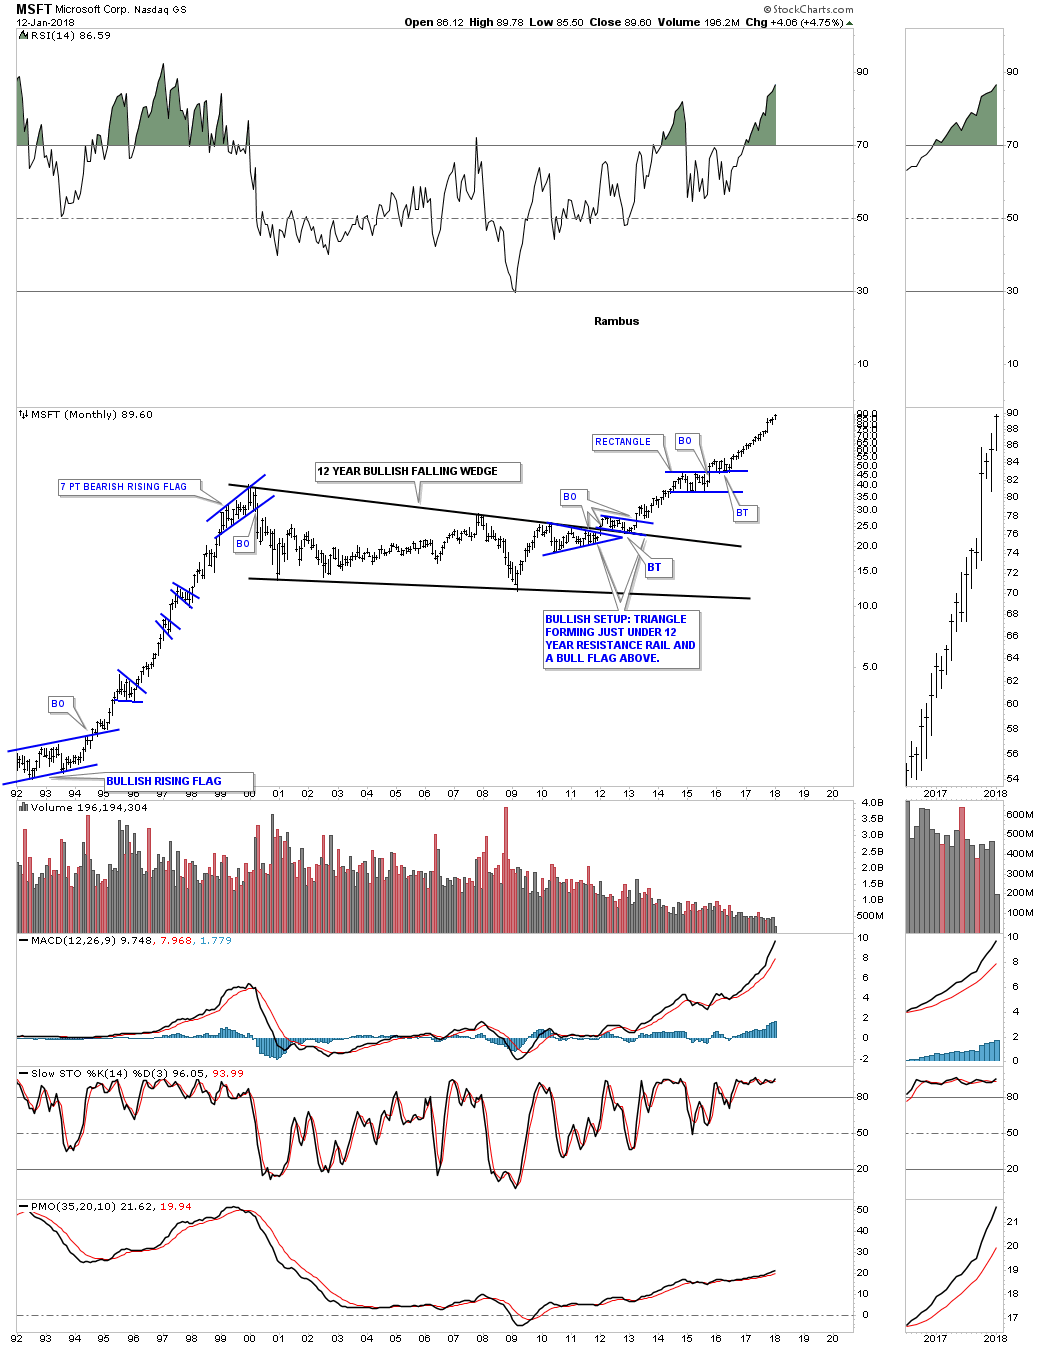
Note the price action leading into MSFT’s 12 year bullish falling wedge and the price action leaving that consolidation pattern. Also notice the bullish setup that took place at the top rail during the breaking out and backtesting process.
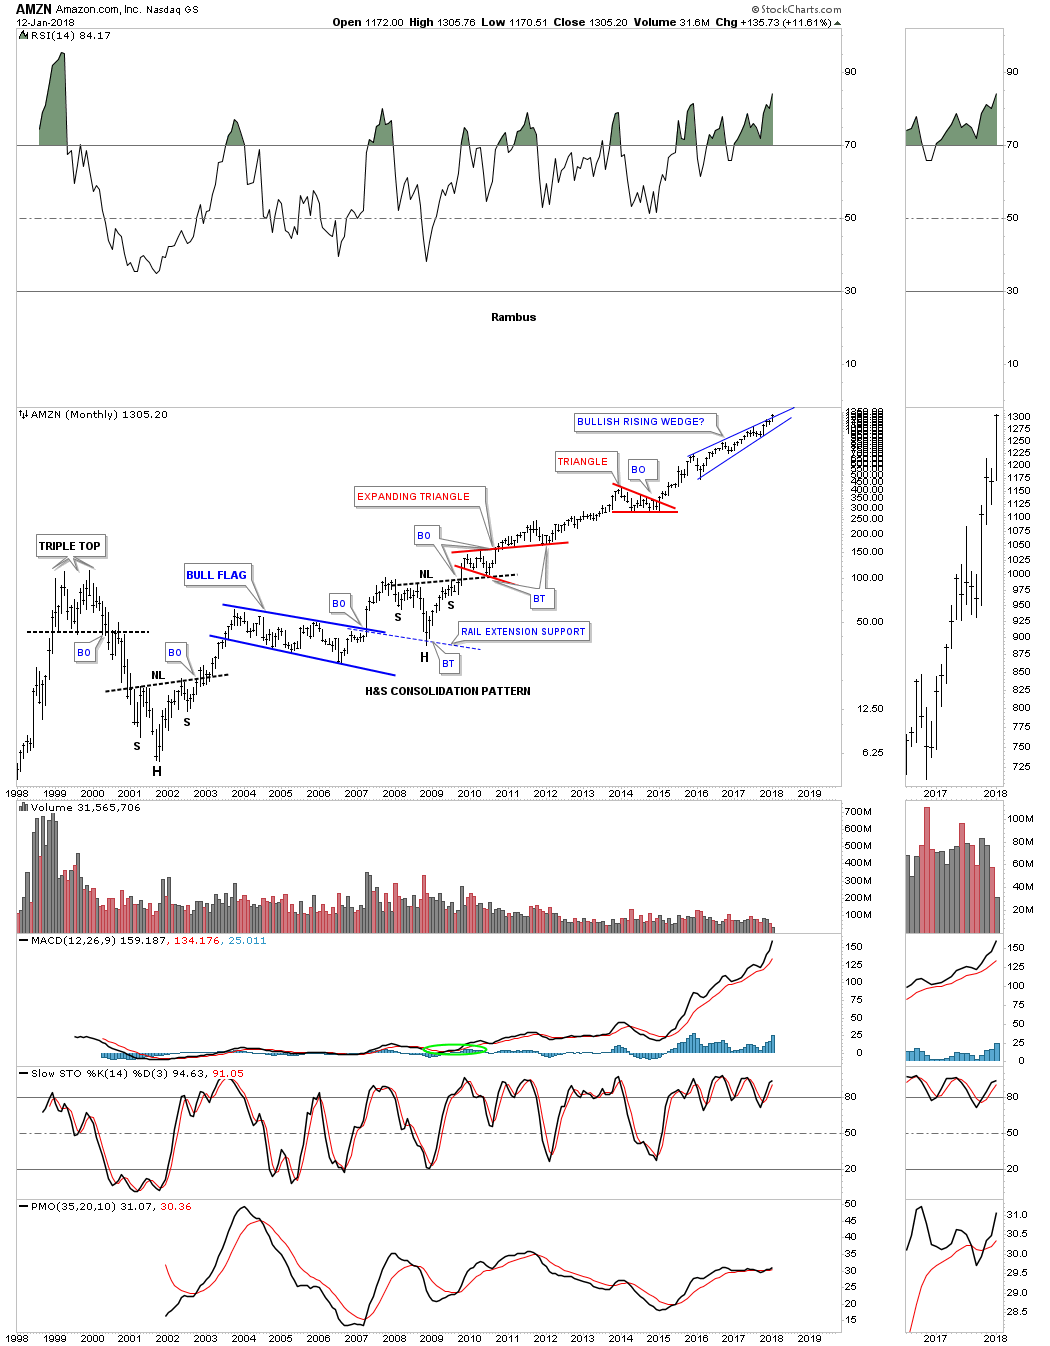
AMZN was a little late to the party in the 1990’s but it had a chance to build out a ten year triangle consolidation pattern before it started on its epic run. Note the bullish setup at the top rail of its triangle consolidation pattern where the price action formed a small blue consolidation pattern below the top rail and another one on top of the triangle, which is almost always a very bullish setup.
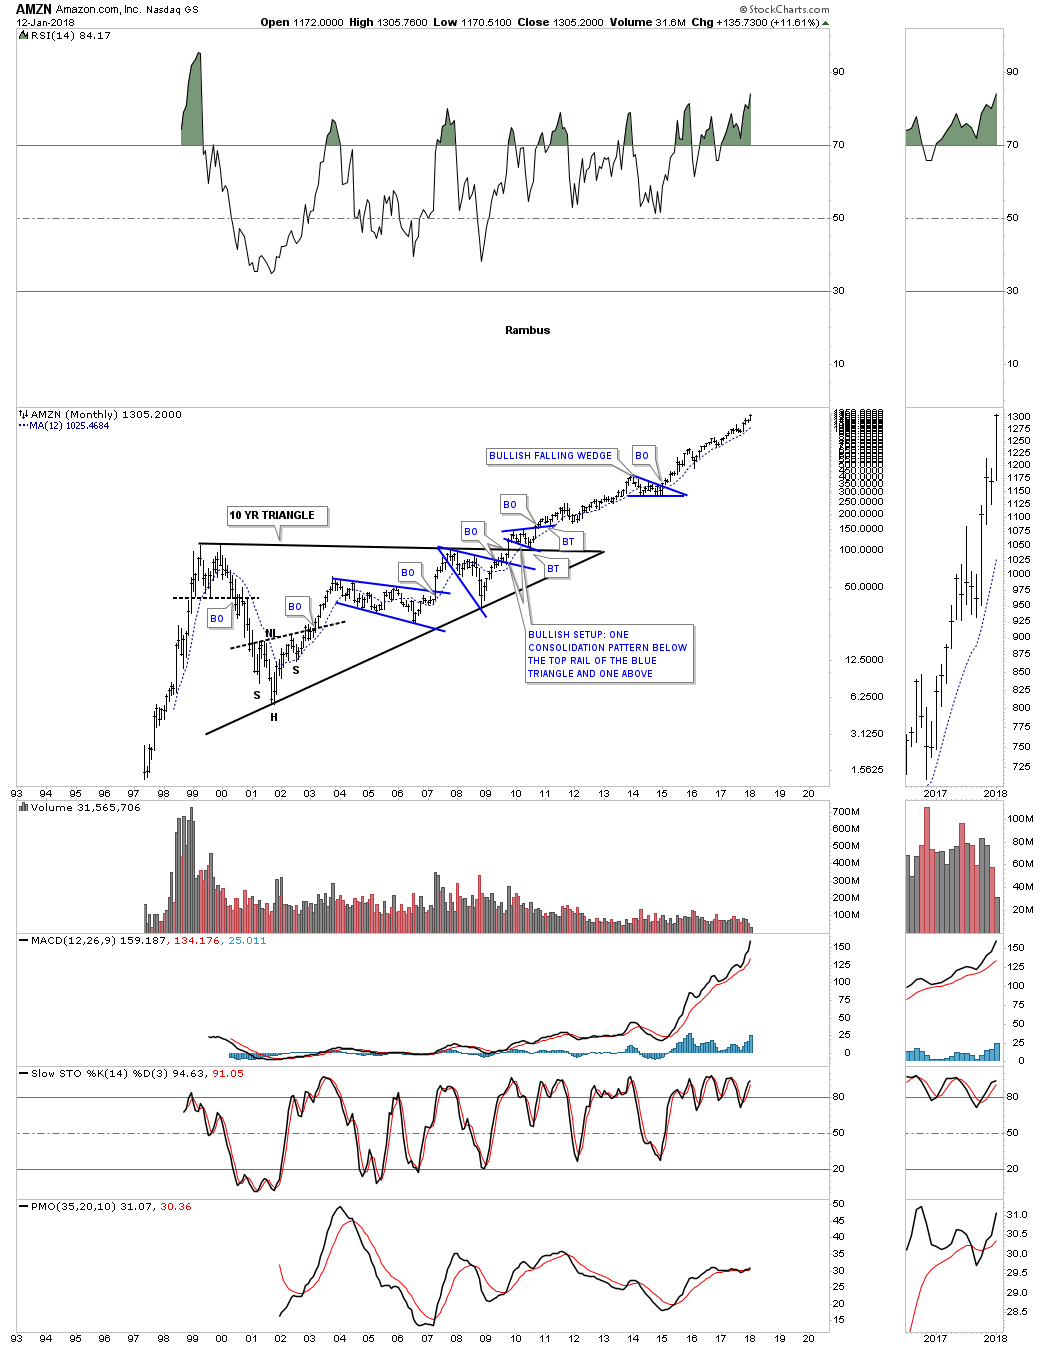
Knowing that AMZN is in a bull market because of the breakout from the 10 year triangle consolidation pattern, you know you can play the long side with much more confidence vs not knowing why AMZN keeps going up. Below is a 20 year look which shows the smaller consolidation patterns that have built out over the last 20 years. Note the two year blue bullish rising wedge at the top of the chart which is on the verge of breaking out.
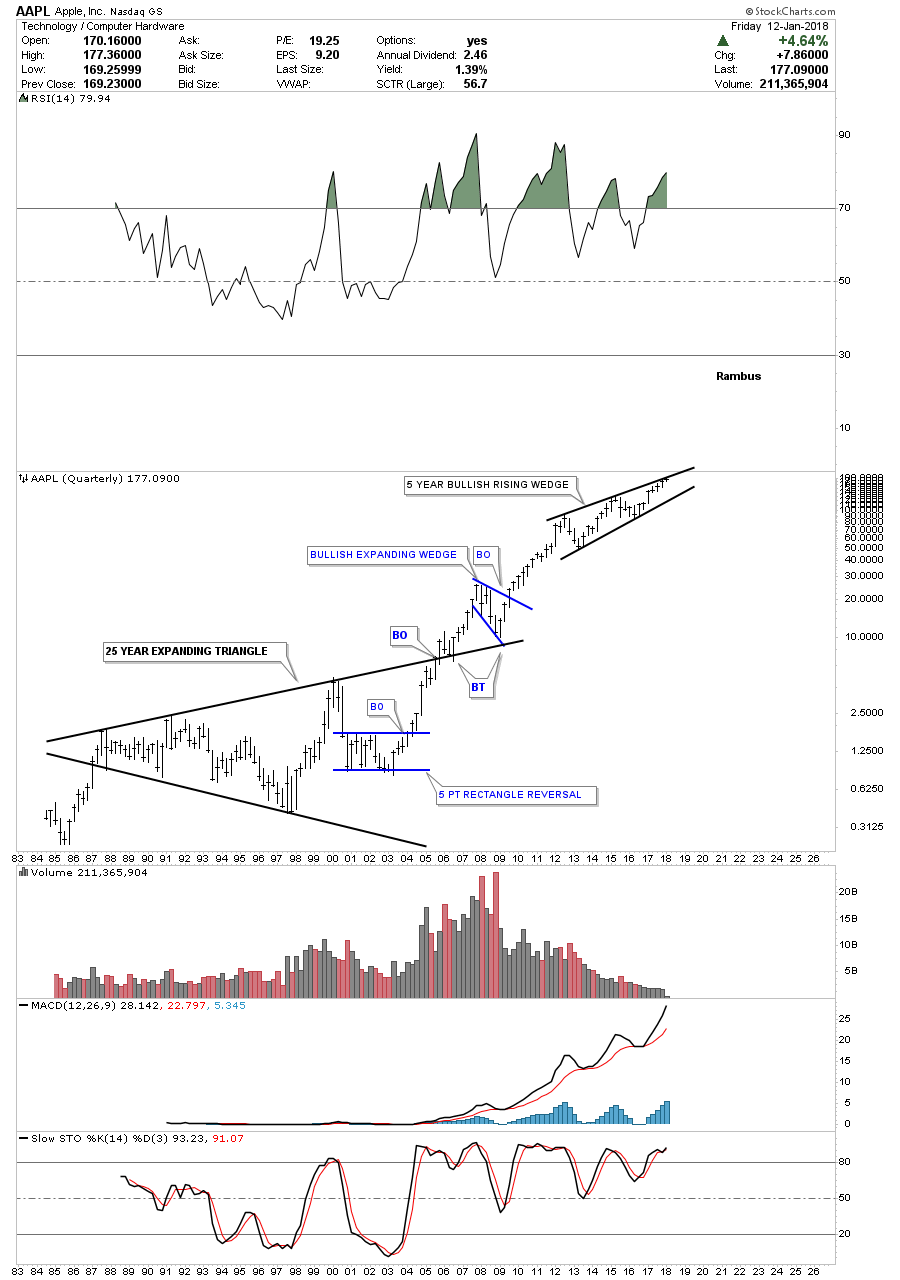
Lets look at one of the biggest cap stocks on the planet AAPL. The Quarterly chart below shows AAPL didn’t look like anything special during its first 25 years of existence when it built out that massive expanding triangle. Once the top rail was broken and backtested AAPL really took off.
Note the rising wedge that has been building out over the last five years or so. If the top rail is broken to the upside that rising wedge will be a bullish rising wedge and you will see a similar impulse move to the one leading into the rising wedge. I know how hard it is to believe something like that is possible, but that’s what the chart pattern is strongly suggesting. When looking at all the other consolidation patterns there is always the impulse move that follows the completing of the consolidation pattern.
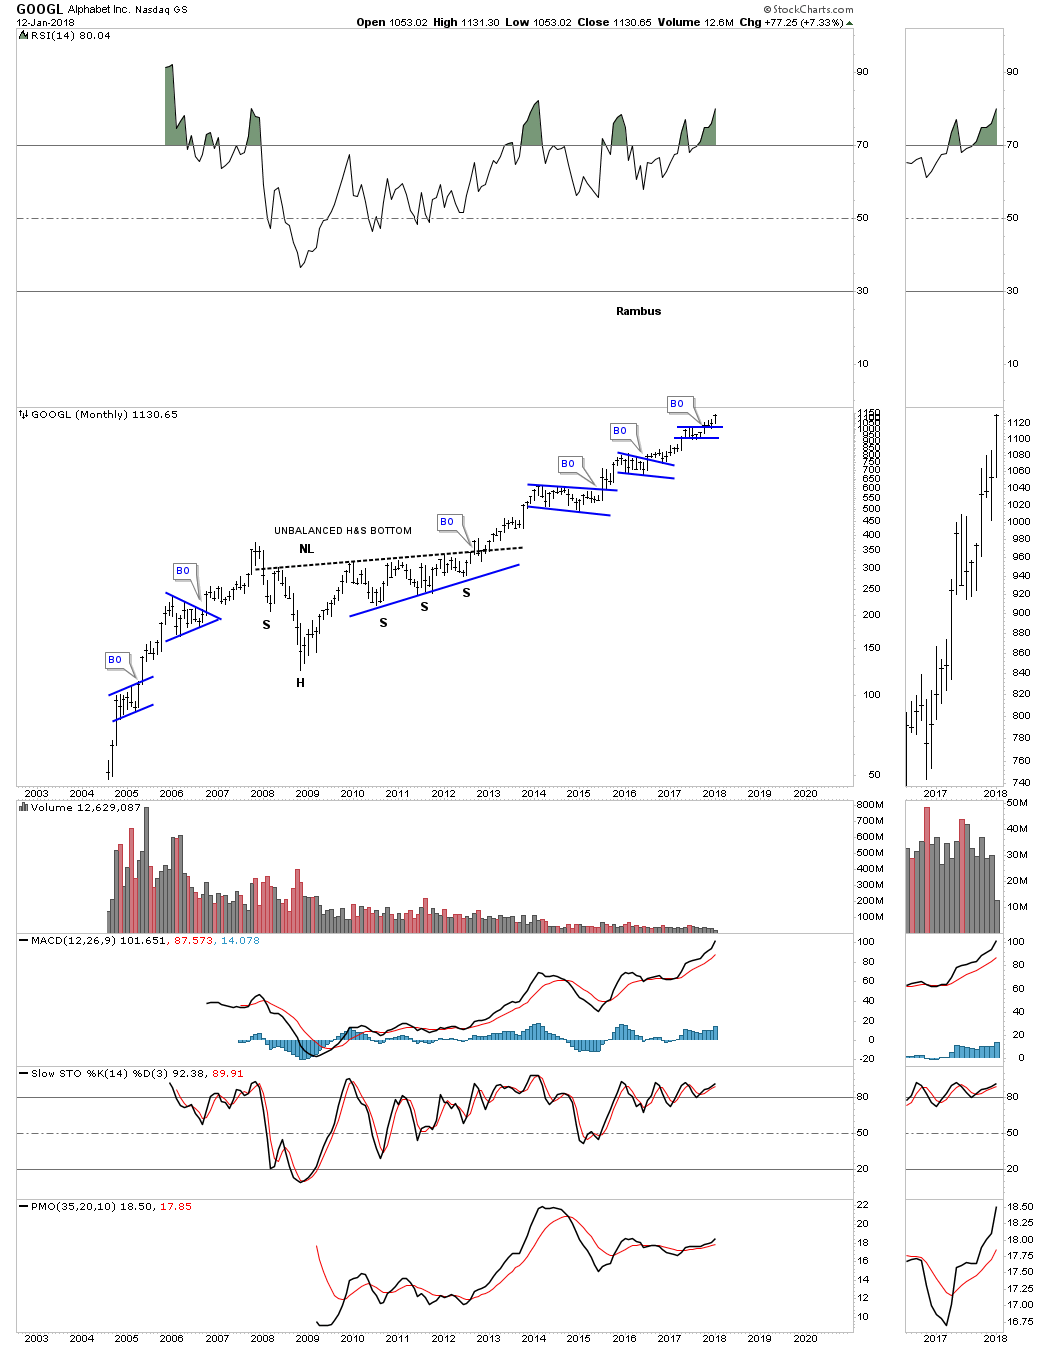
The 15 year chart for GOOGL shows you exactly what a bull market looks like. It has just recently broken out of a small rectangle.
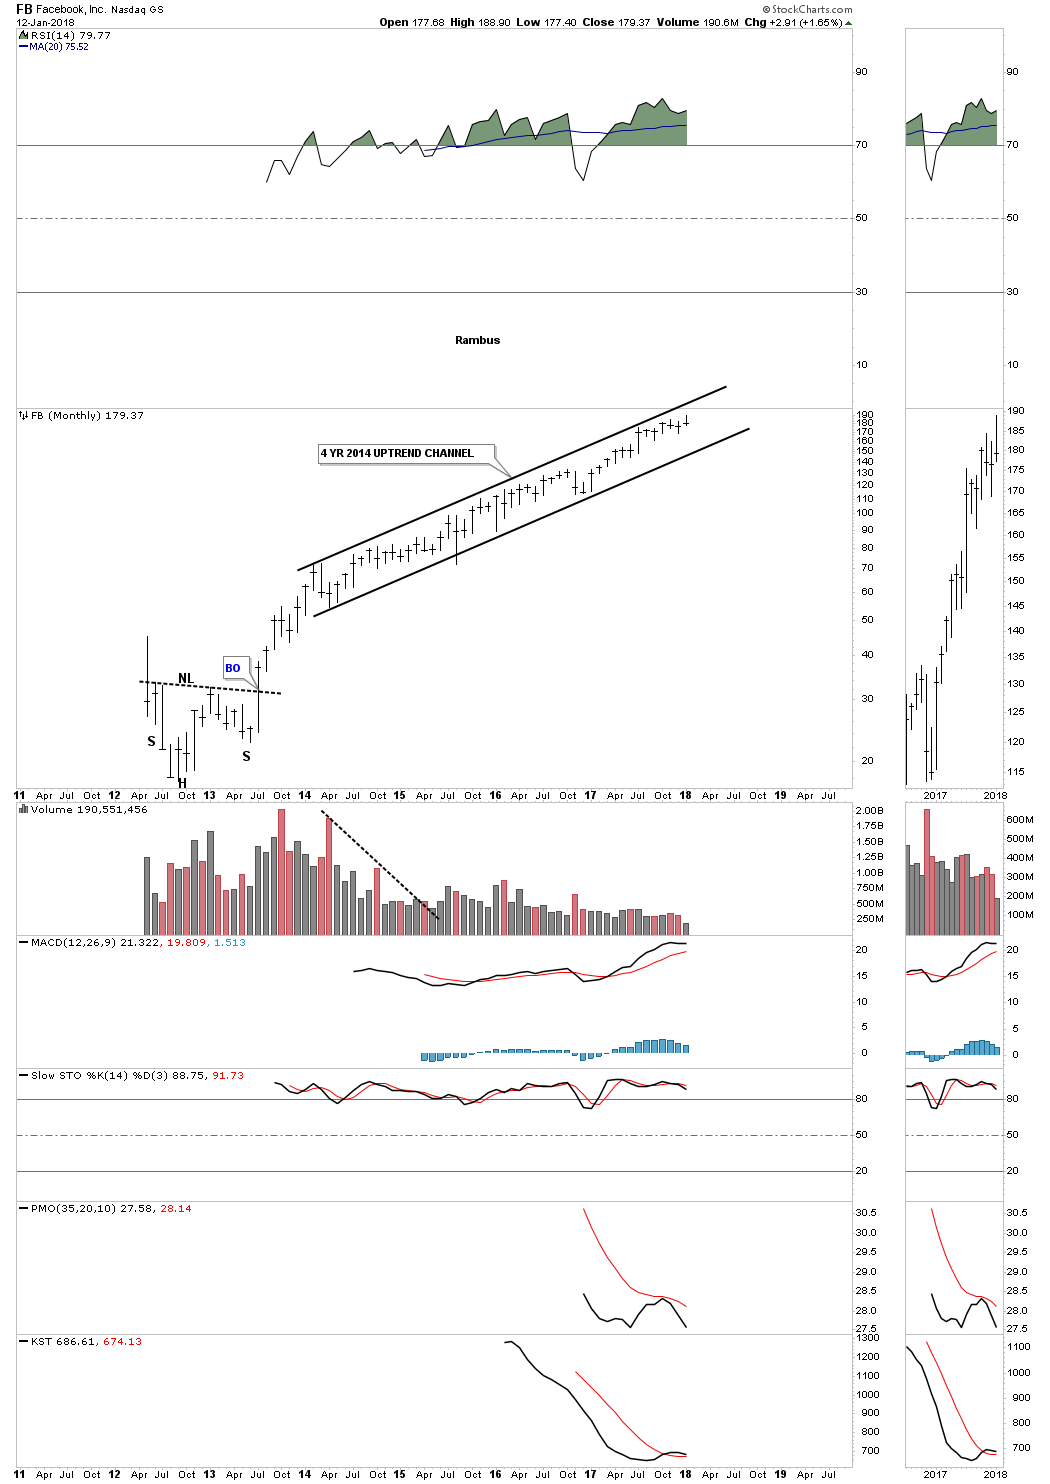
FB hasn’t spent much time consolidating.
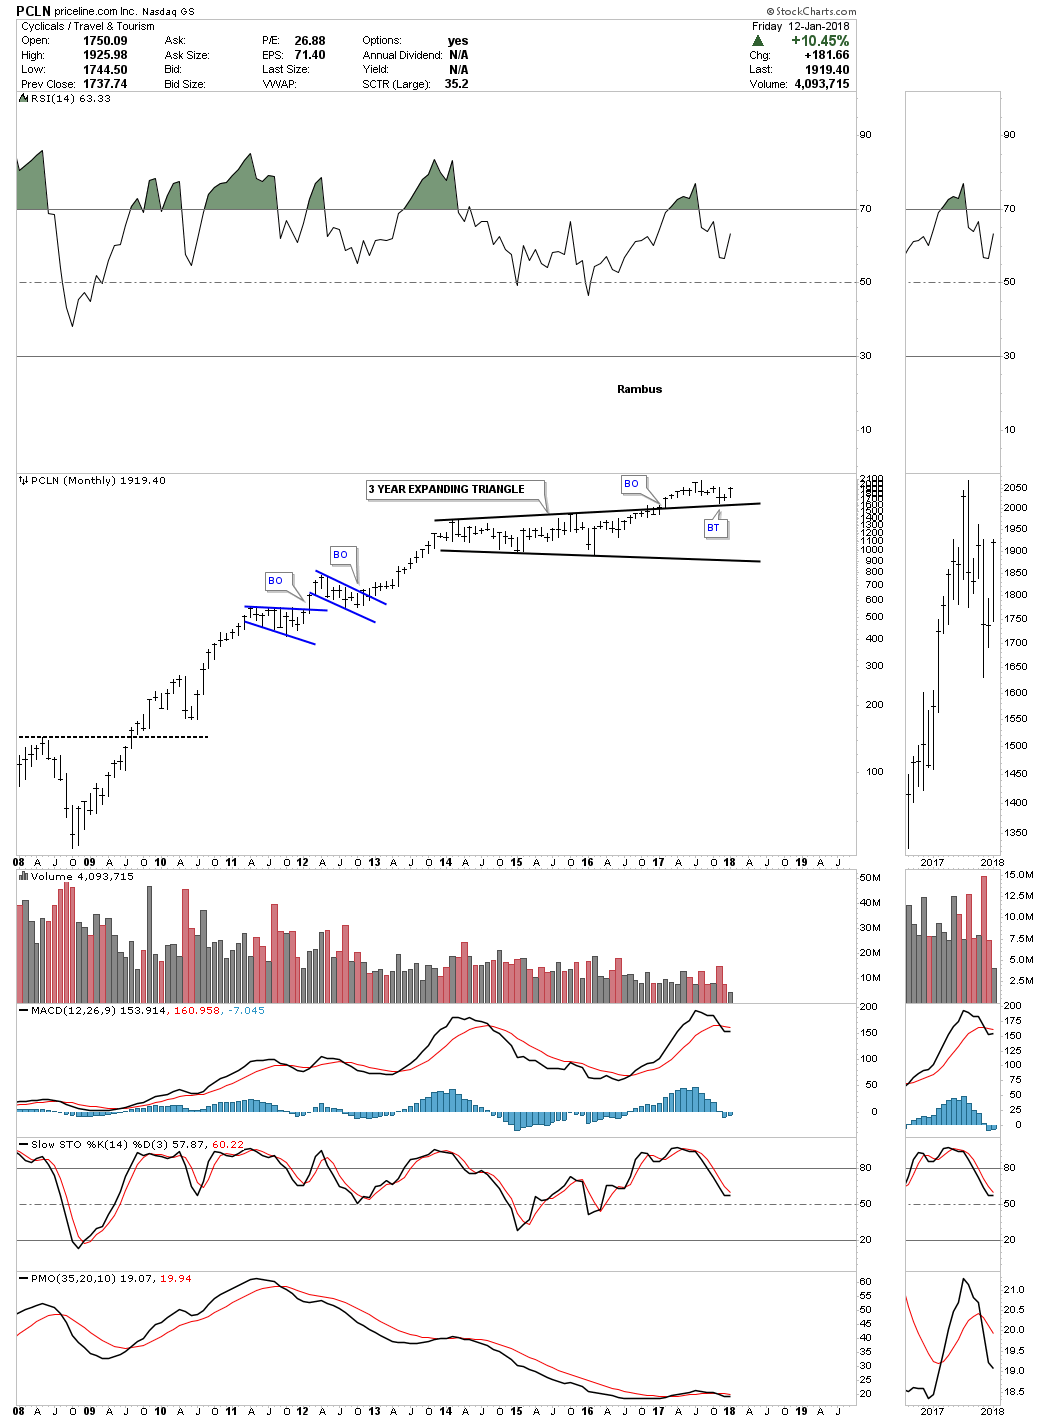
PCLN broke out from a three year expanding triangle about one year ago and is now backtesting the top rail.
TSLA is setup fairly similar to PCLN.

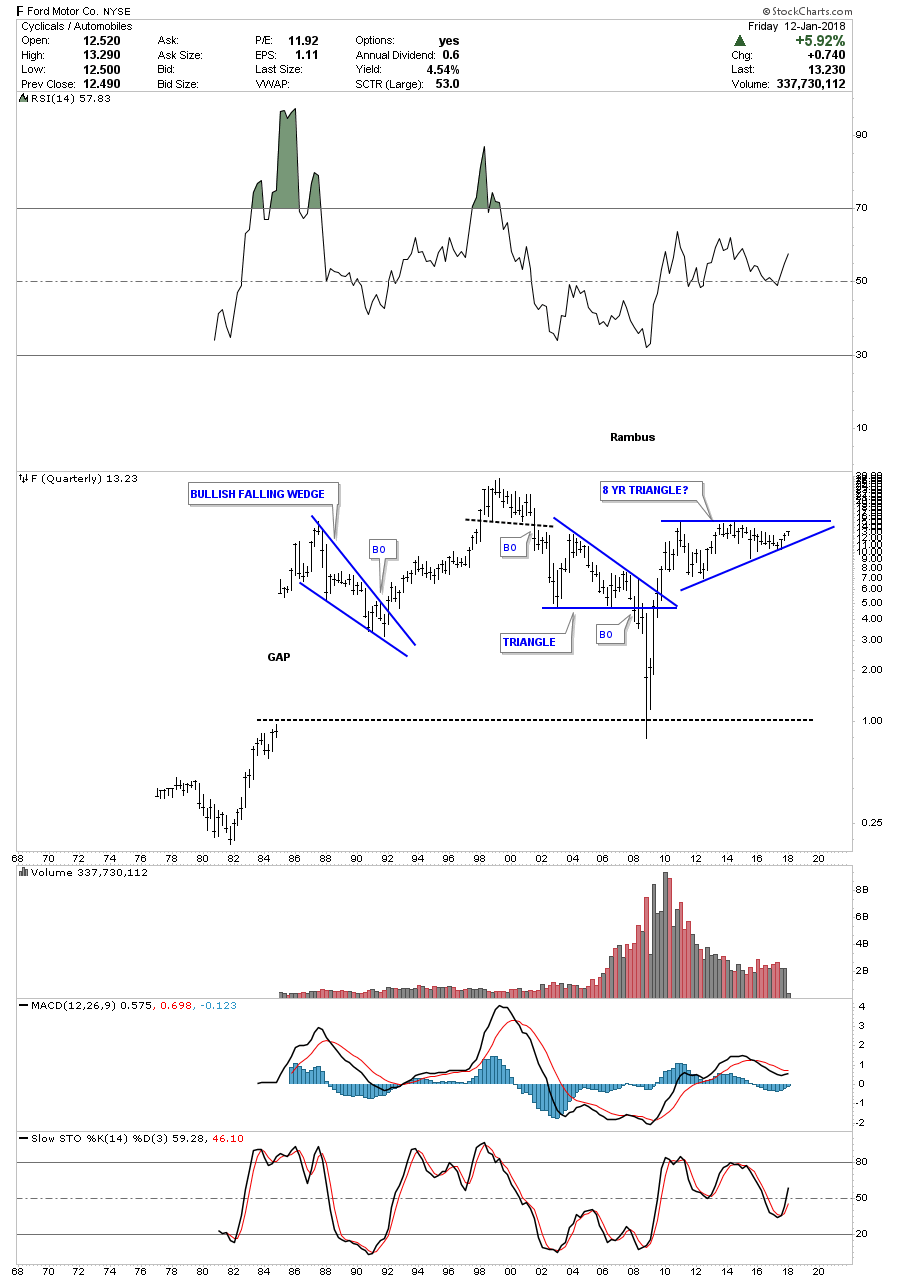
If F breaks out from that eight year triangle consolidation pattern what is that telling us about the auto industry? A new revolution in cars is coming, perhaps?
IBM was actually one of the first tech stocks to breakout from its massive ten year ascending triangle. After nearly doubling after the breakout IBM needed to consolidate that impulse move and formed the blue six point bullish expanding falling wedge with the top rail being backtested for the second time about six months ago. It’s easily in a position where it could make new all time highs in the not to distance future.

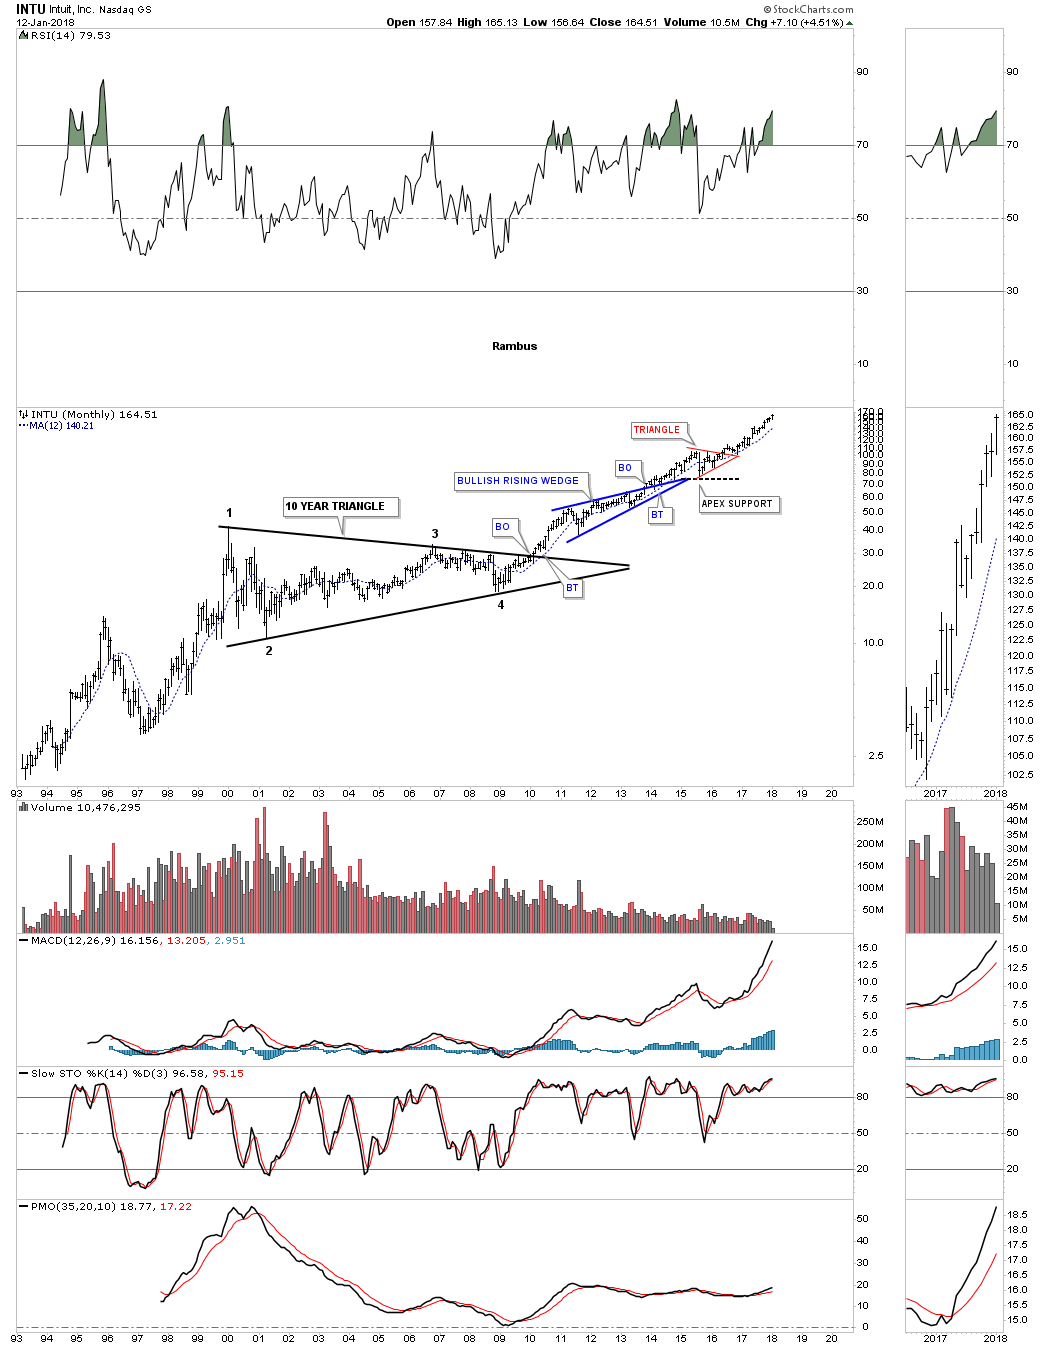
INTU hasn’t looked back since it broke out from its 10 year triangle consolidation pattern.
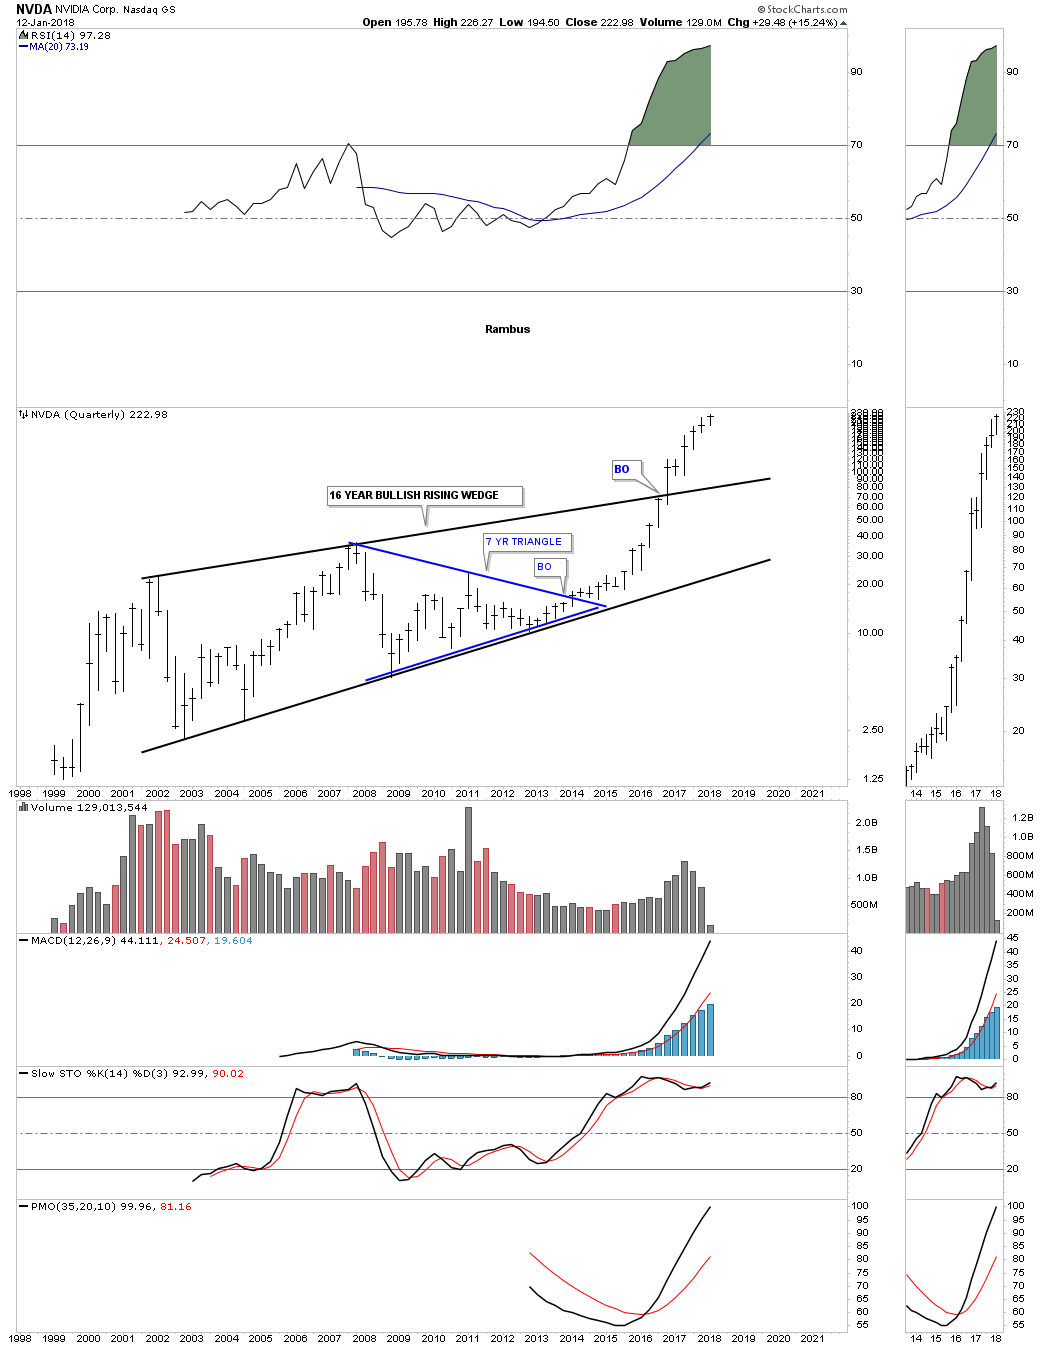
NVDA is another stock that hasn’t looked back since it broke out of its seven year triangle consolidation pattern.
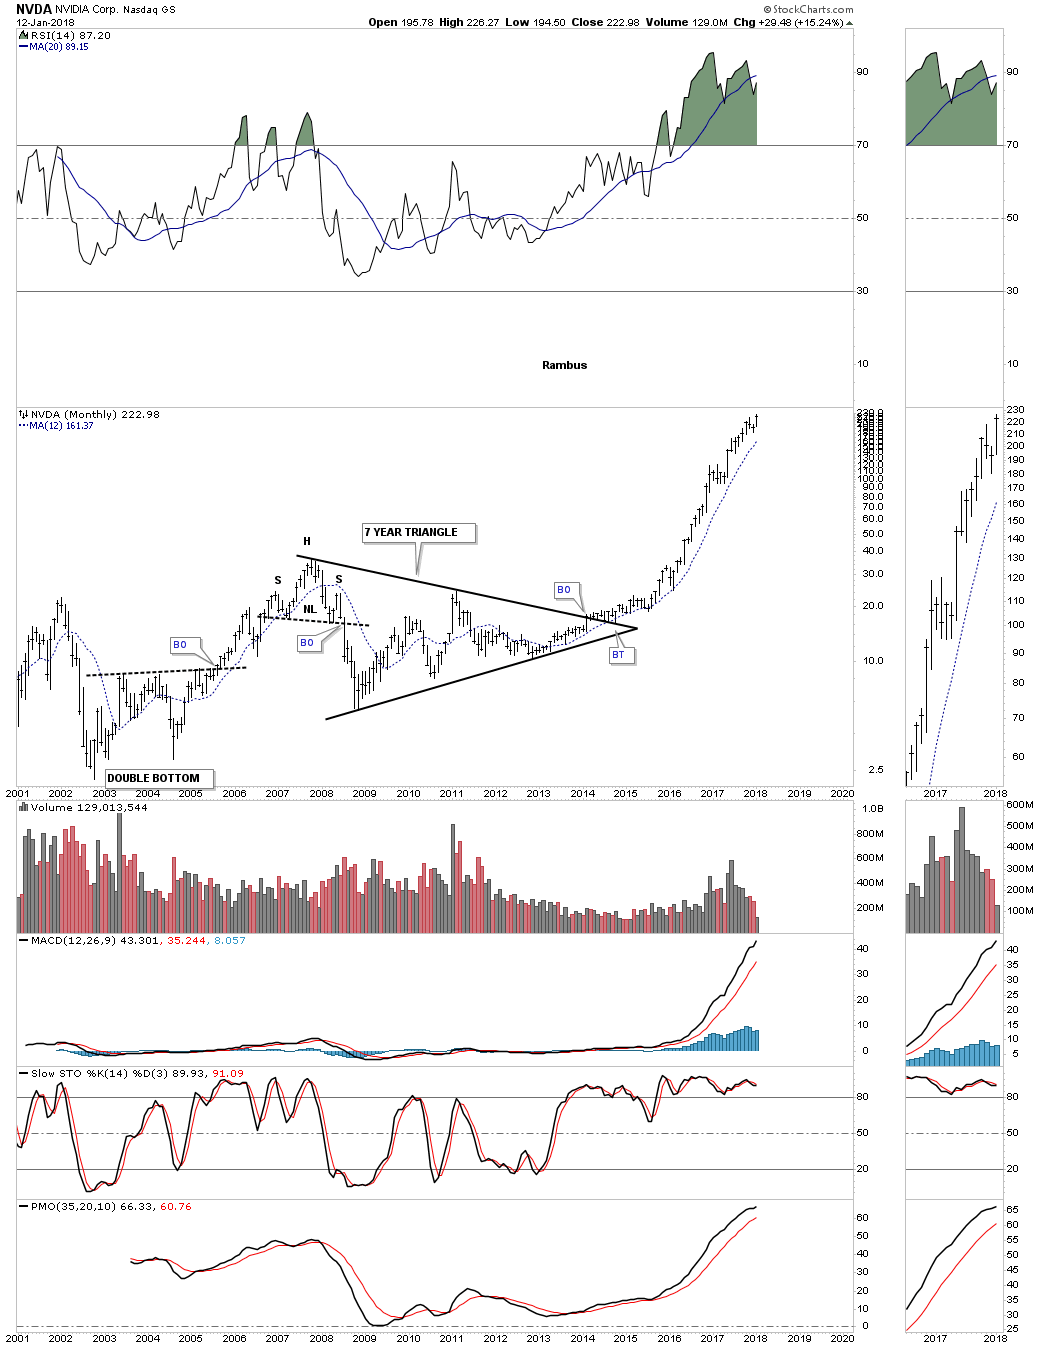
The long term quarterly chart for NVDA shows the seven year triangle above as just a part of a much bigger 16 year bullish rising wedge.
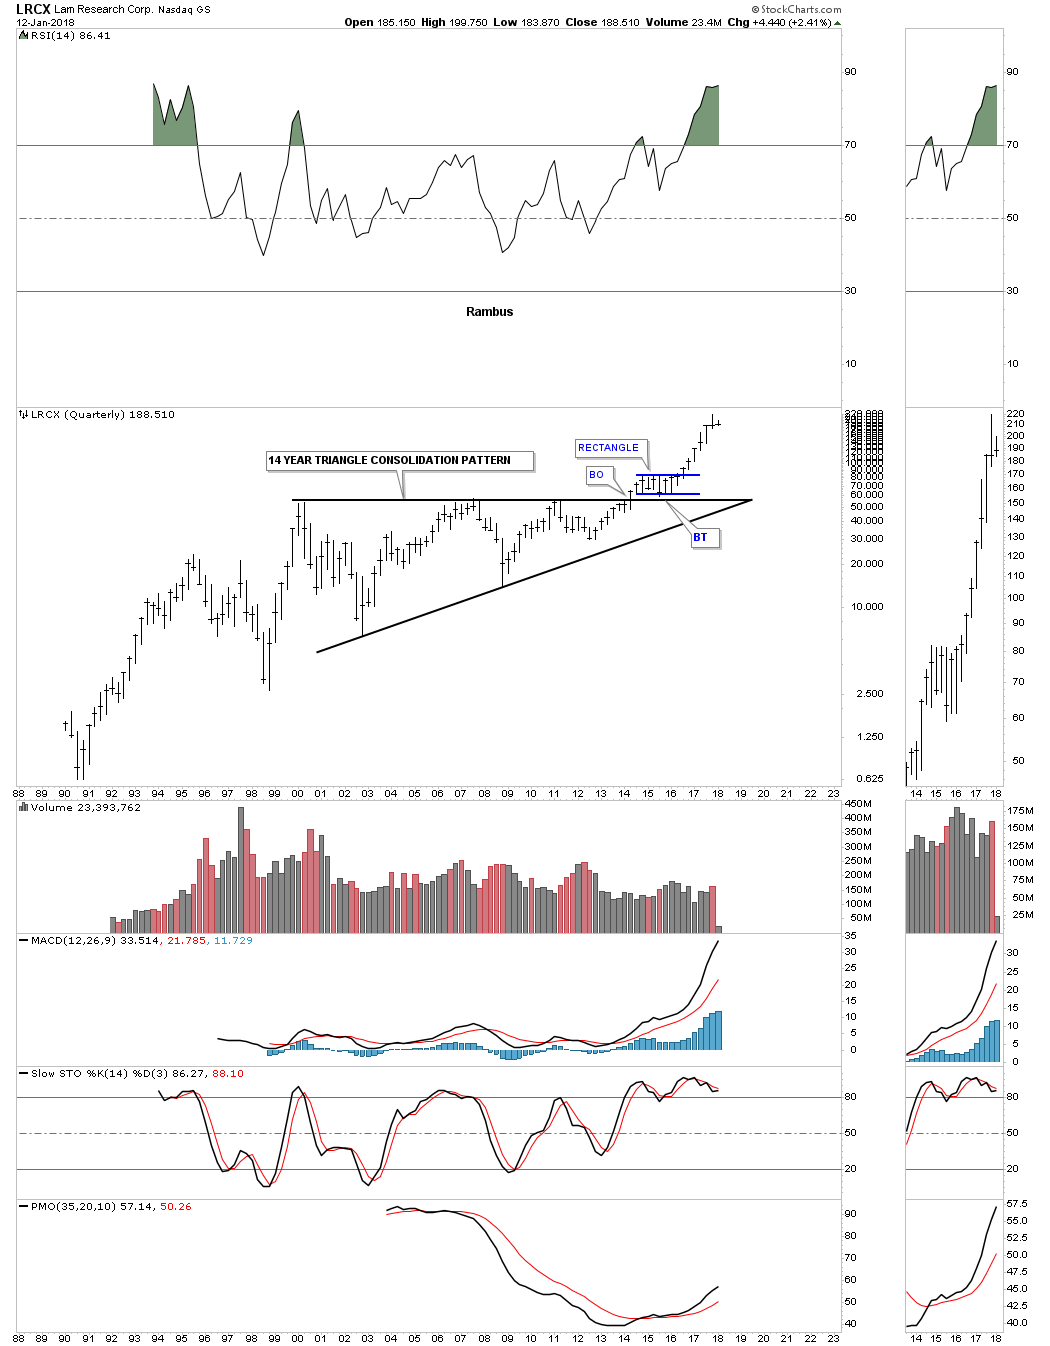
Below is a long term quarterly chart for LRCX.
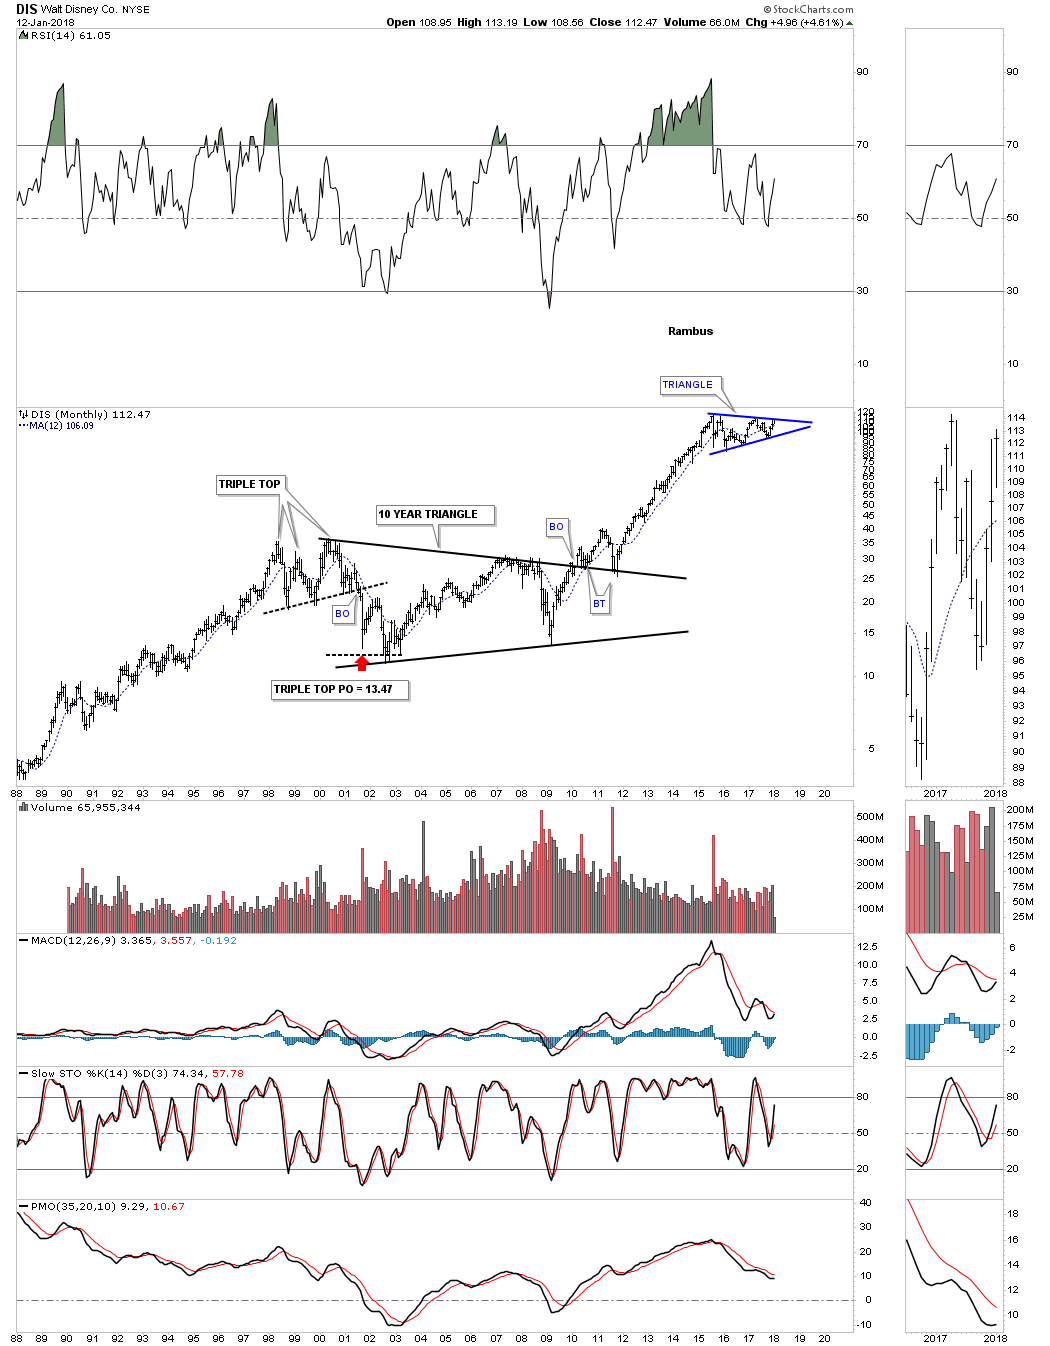
The 30 year monthly chart for DIS shows a beautiful example of how the 10 year triangle consolidation pattern fits into the big picture. Looking at the top of the chart you can see a two year triangle pattern that is building out. Knowing that DIS is in a bull market the odds favor the blue triangle will breakout to the upside and produce another impulse leg.
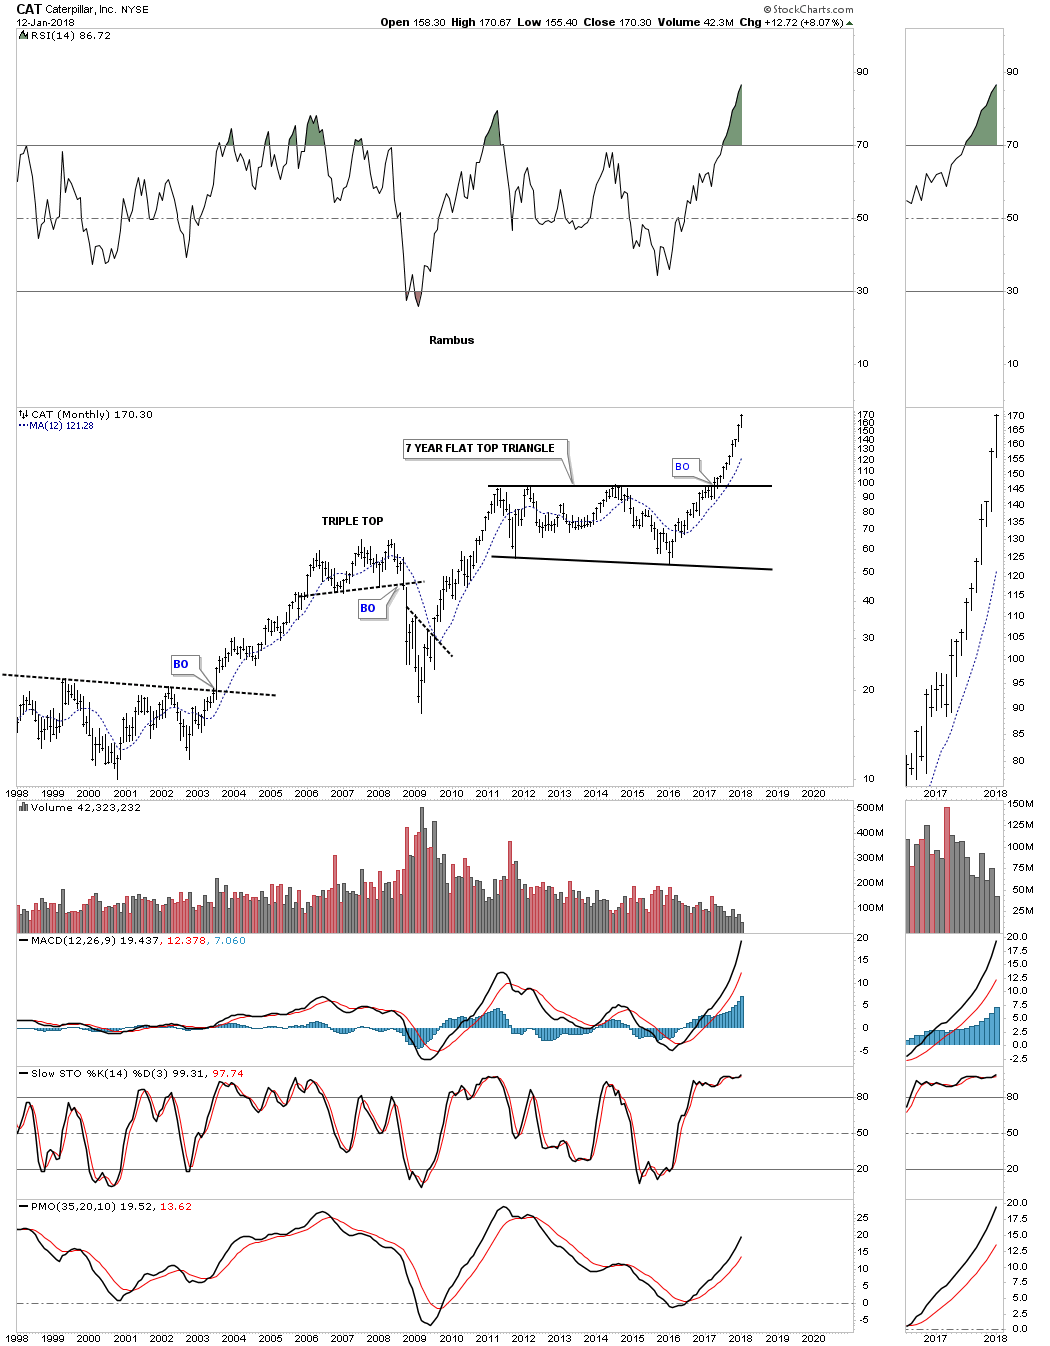
CAT is setup a little differently than some of the other big consolidation patterns we’ve looked at. It broke out from a seven year flat top triangle about a year ago and hasn’t looked back.
FFIV has been building out an eight year rectangle consolidation pattern and is currently testing the top rail.

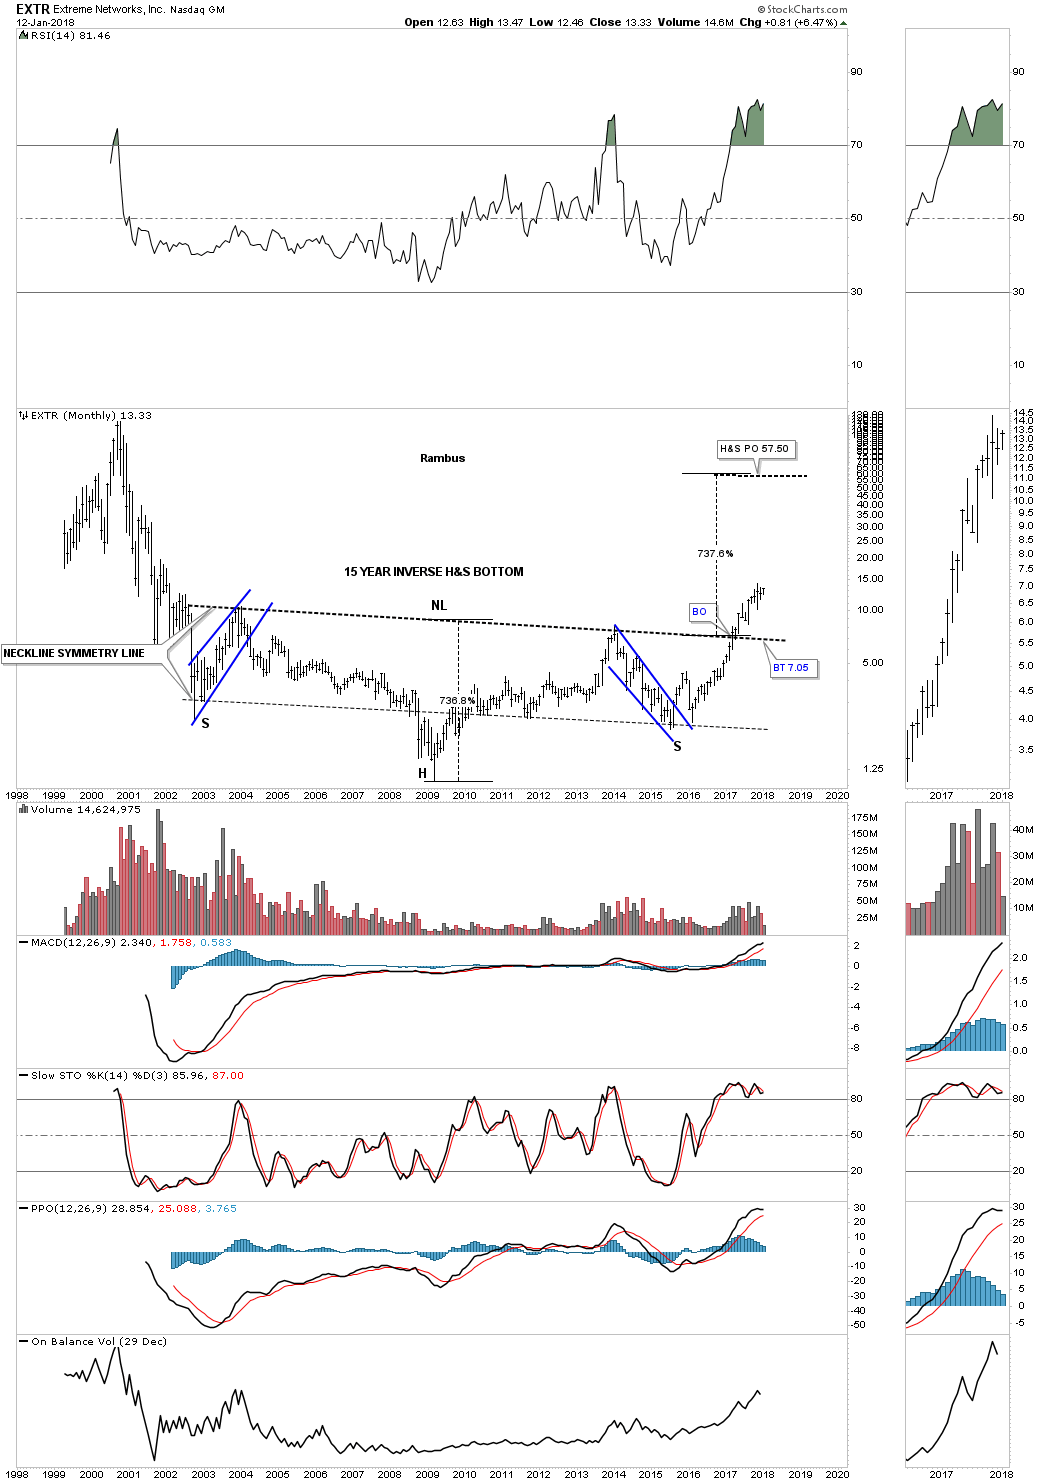
EXTR has built out a massive and very symmetrical 15 year H&S bottom. This one got away from me as I was looking for a little more backtesting to take place before the impulse move began.
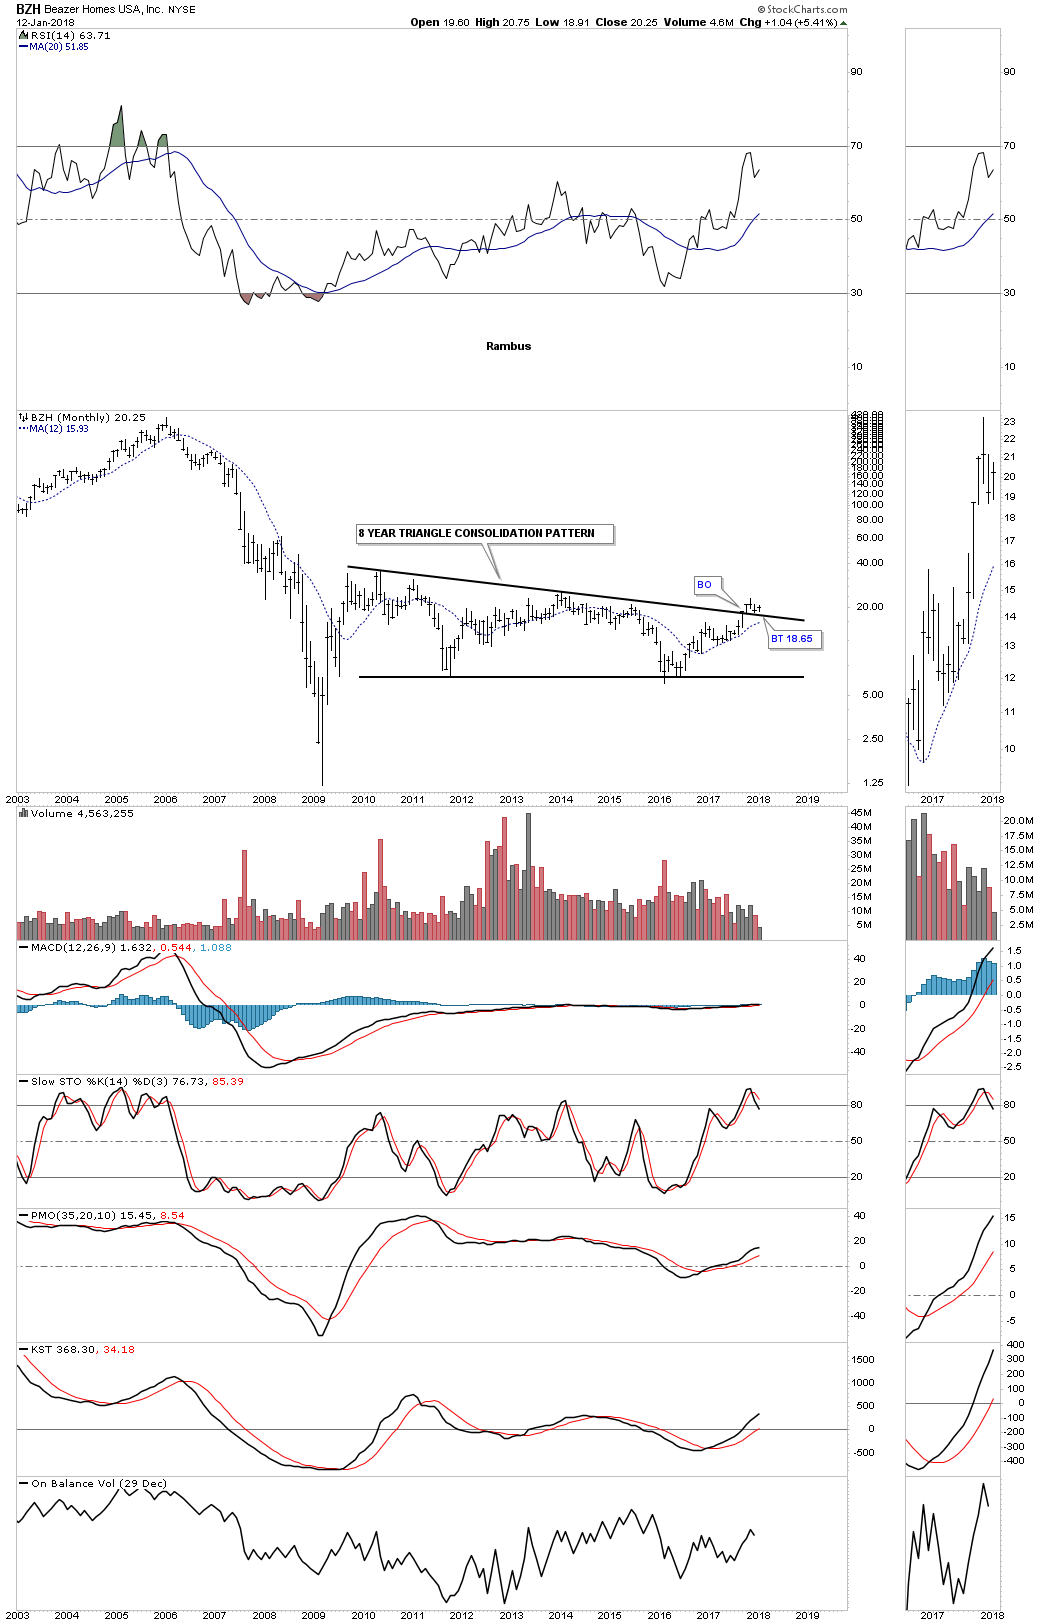
BZH is currently in backtest mode to the top rail of its eight year triangle consolidation pattern.
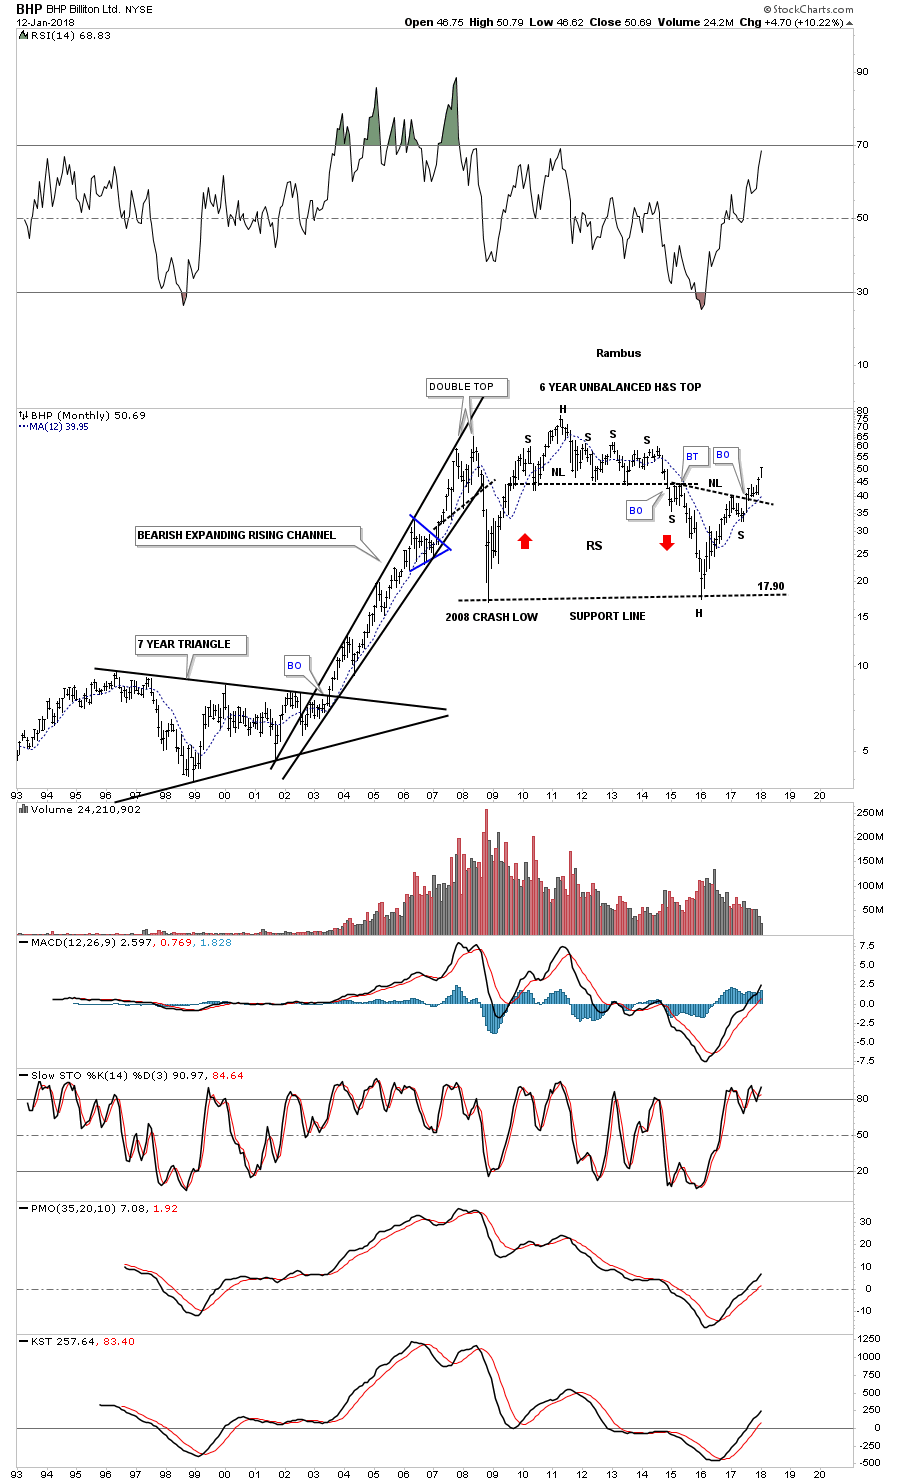
BHP has created several large patterns on the long term monthly chart, but the most important one right now is the 2 1/2 year H&S bottom which broke out and backtested the neckline about eight months ago.
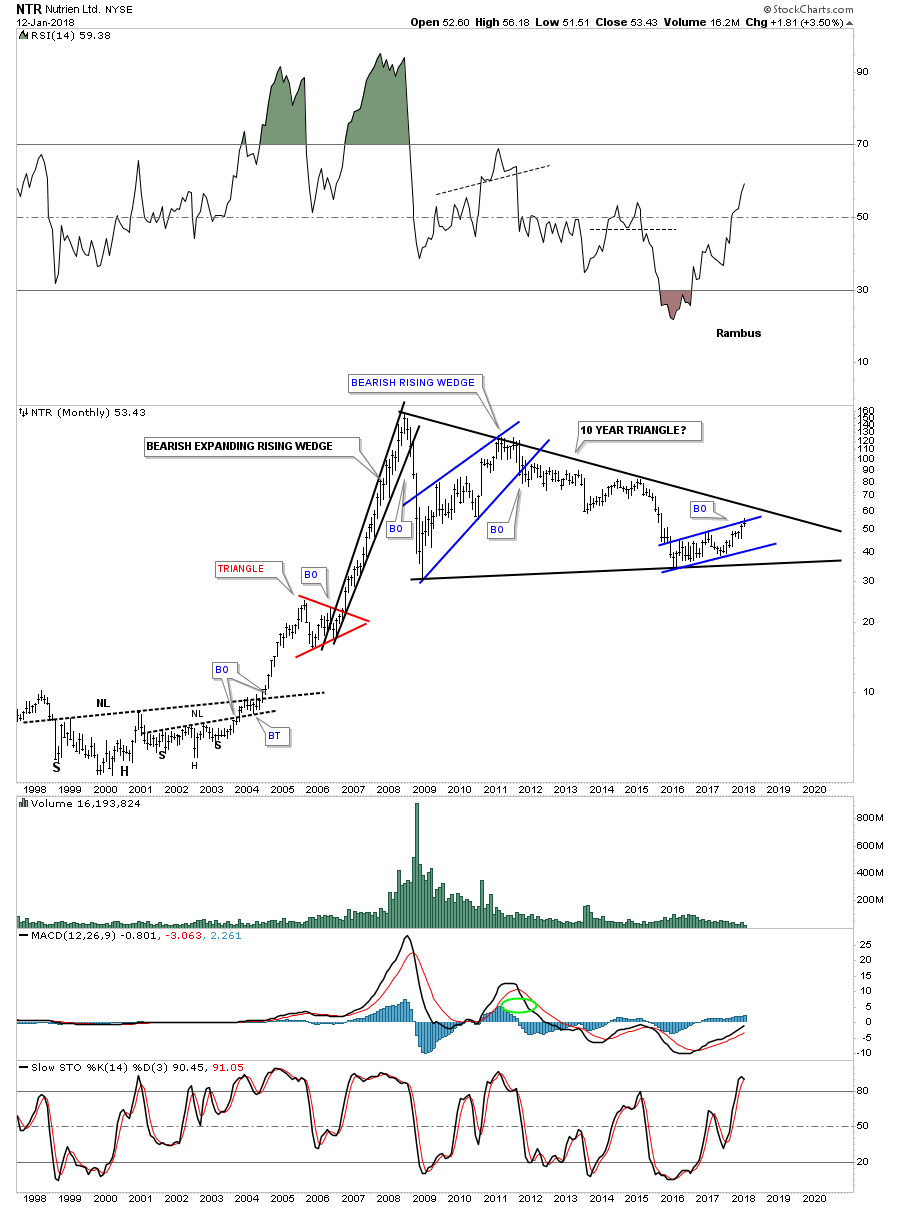
NTR is still trading inside of its ten year triangle consolidation pattern.
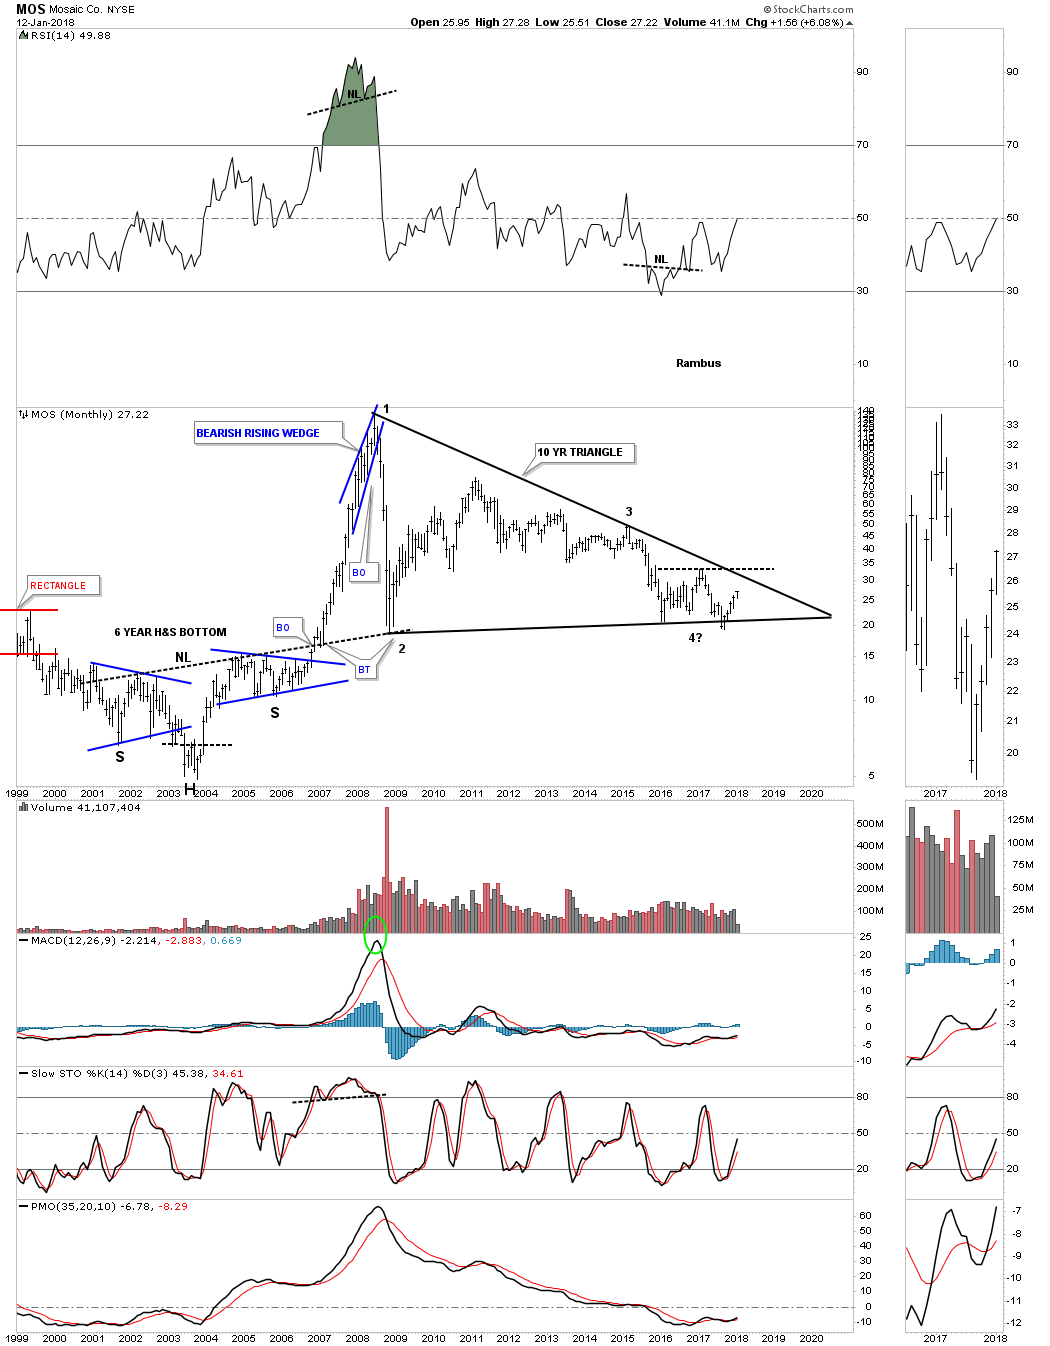
MOS is another stock that is still trading inside of its ten year triangle.
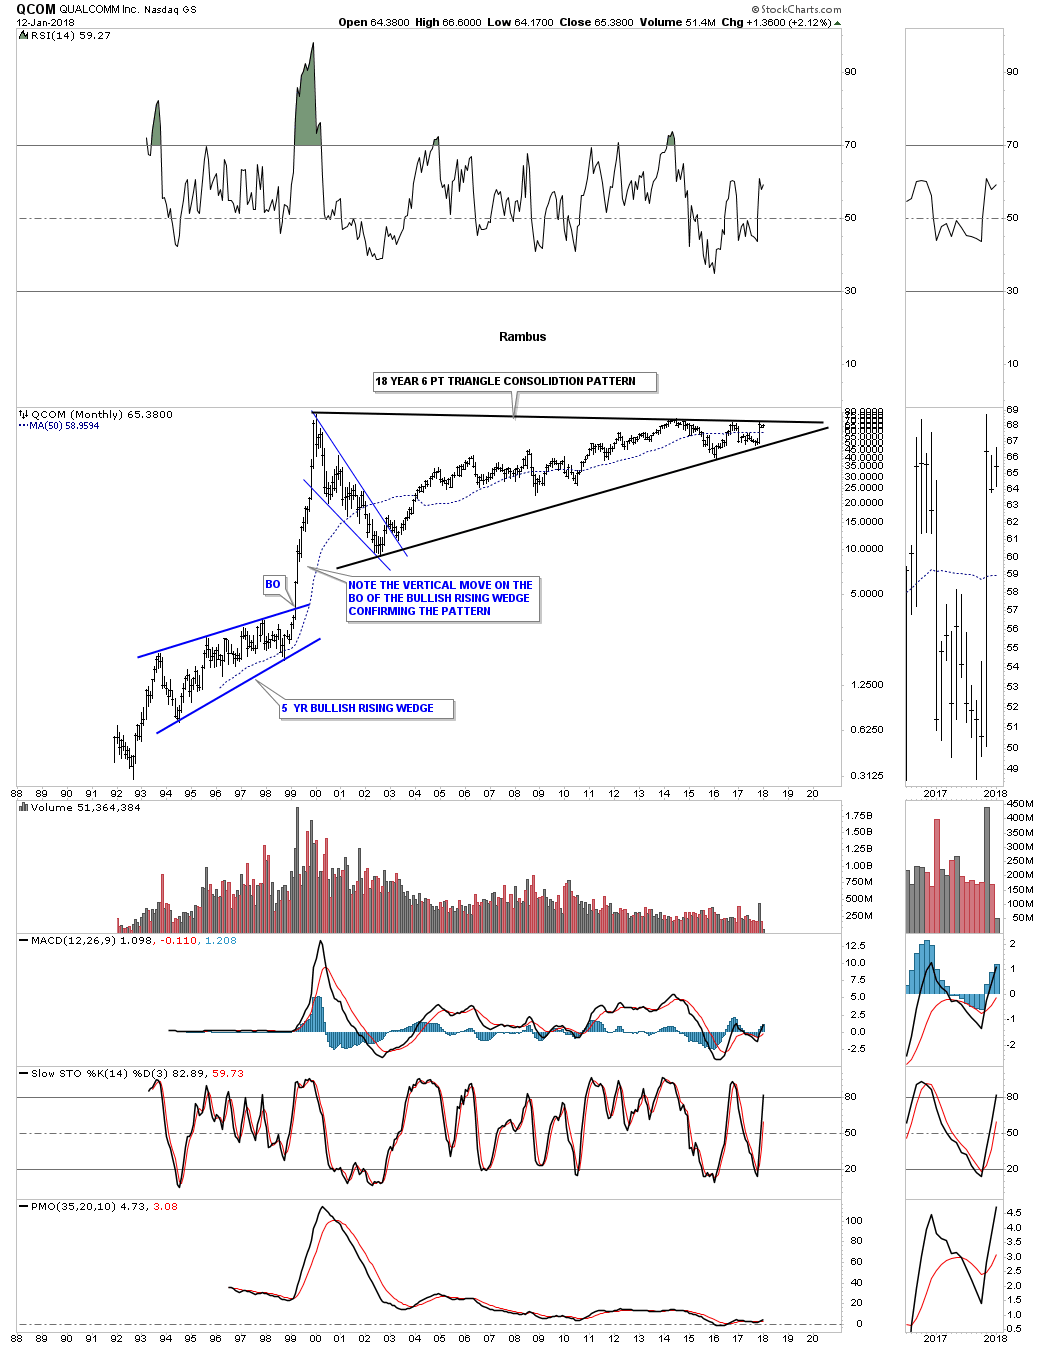
During the 1990’s bull market QCOM was touted to be the first stock in history to trade up to 1000 a share. Note the vertical move once the blue bullish rising wedge was completed. The price action is currently testing the top rail of its 18 year flat top triangle.
I could go on, but I need to stop and get this posted. The value of recognizing big chart patterns is for the impulse move that follows the breakout. As we discussed in Part 1 of this report, the impulse move out of a chart pattern is relative to the size of the pattern. Small chart patterns lead to small moves while big chart patterns lead to big moves. It’s all relative when it comes to the markets. All the best…Rambus
Catherine Austin Fitts:
Rambus, I can't thank you enough. This is Blockbuster Chartology! We have a lot to study and digest. Let me remind our subscribers that they can access your ongoing efforts at: http://rambus1.com.
Related Reading:
- 2017 Annual Wrap Up - Does Your Pension Fund Have A Deep State Drain? - January, 2018
- Blockbuster Chartology with Rambus - October, 2017
- Blockbuster Chartology with Rambus - July, 2017
- Blockbuster Chartology with Rambus - May, 2017
- Blockbuster Chartology with Rambus - January, 2017
- Blockbuster Chartology with Rambus - October 20, 2016
- Blockbuster Chartology with Rambus - July 21, 2016
- Blockbuster Chartology with Rambus - April 21, 2016
- Rambus: Are We in a Deflationary Spiral? - January 28, 2016
- The Dollar, Gold & the S&P 500 with Rambus - October 15, 2015
Top of Page
© Solari 2016